
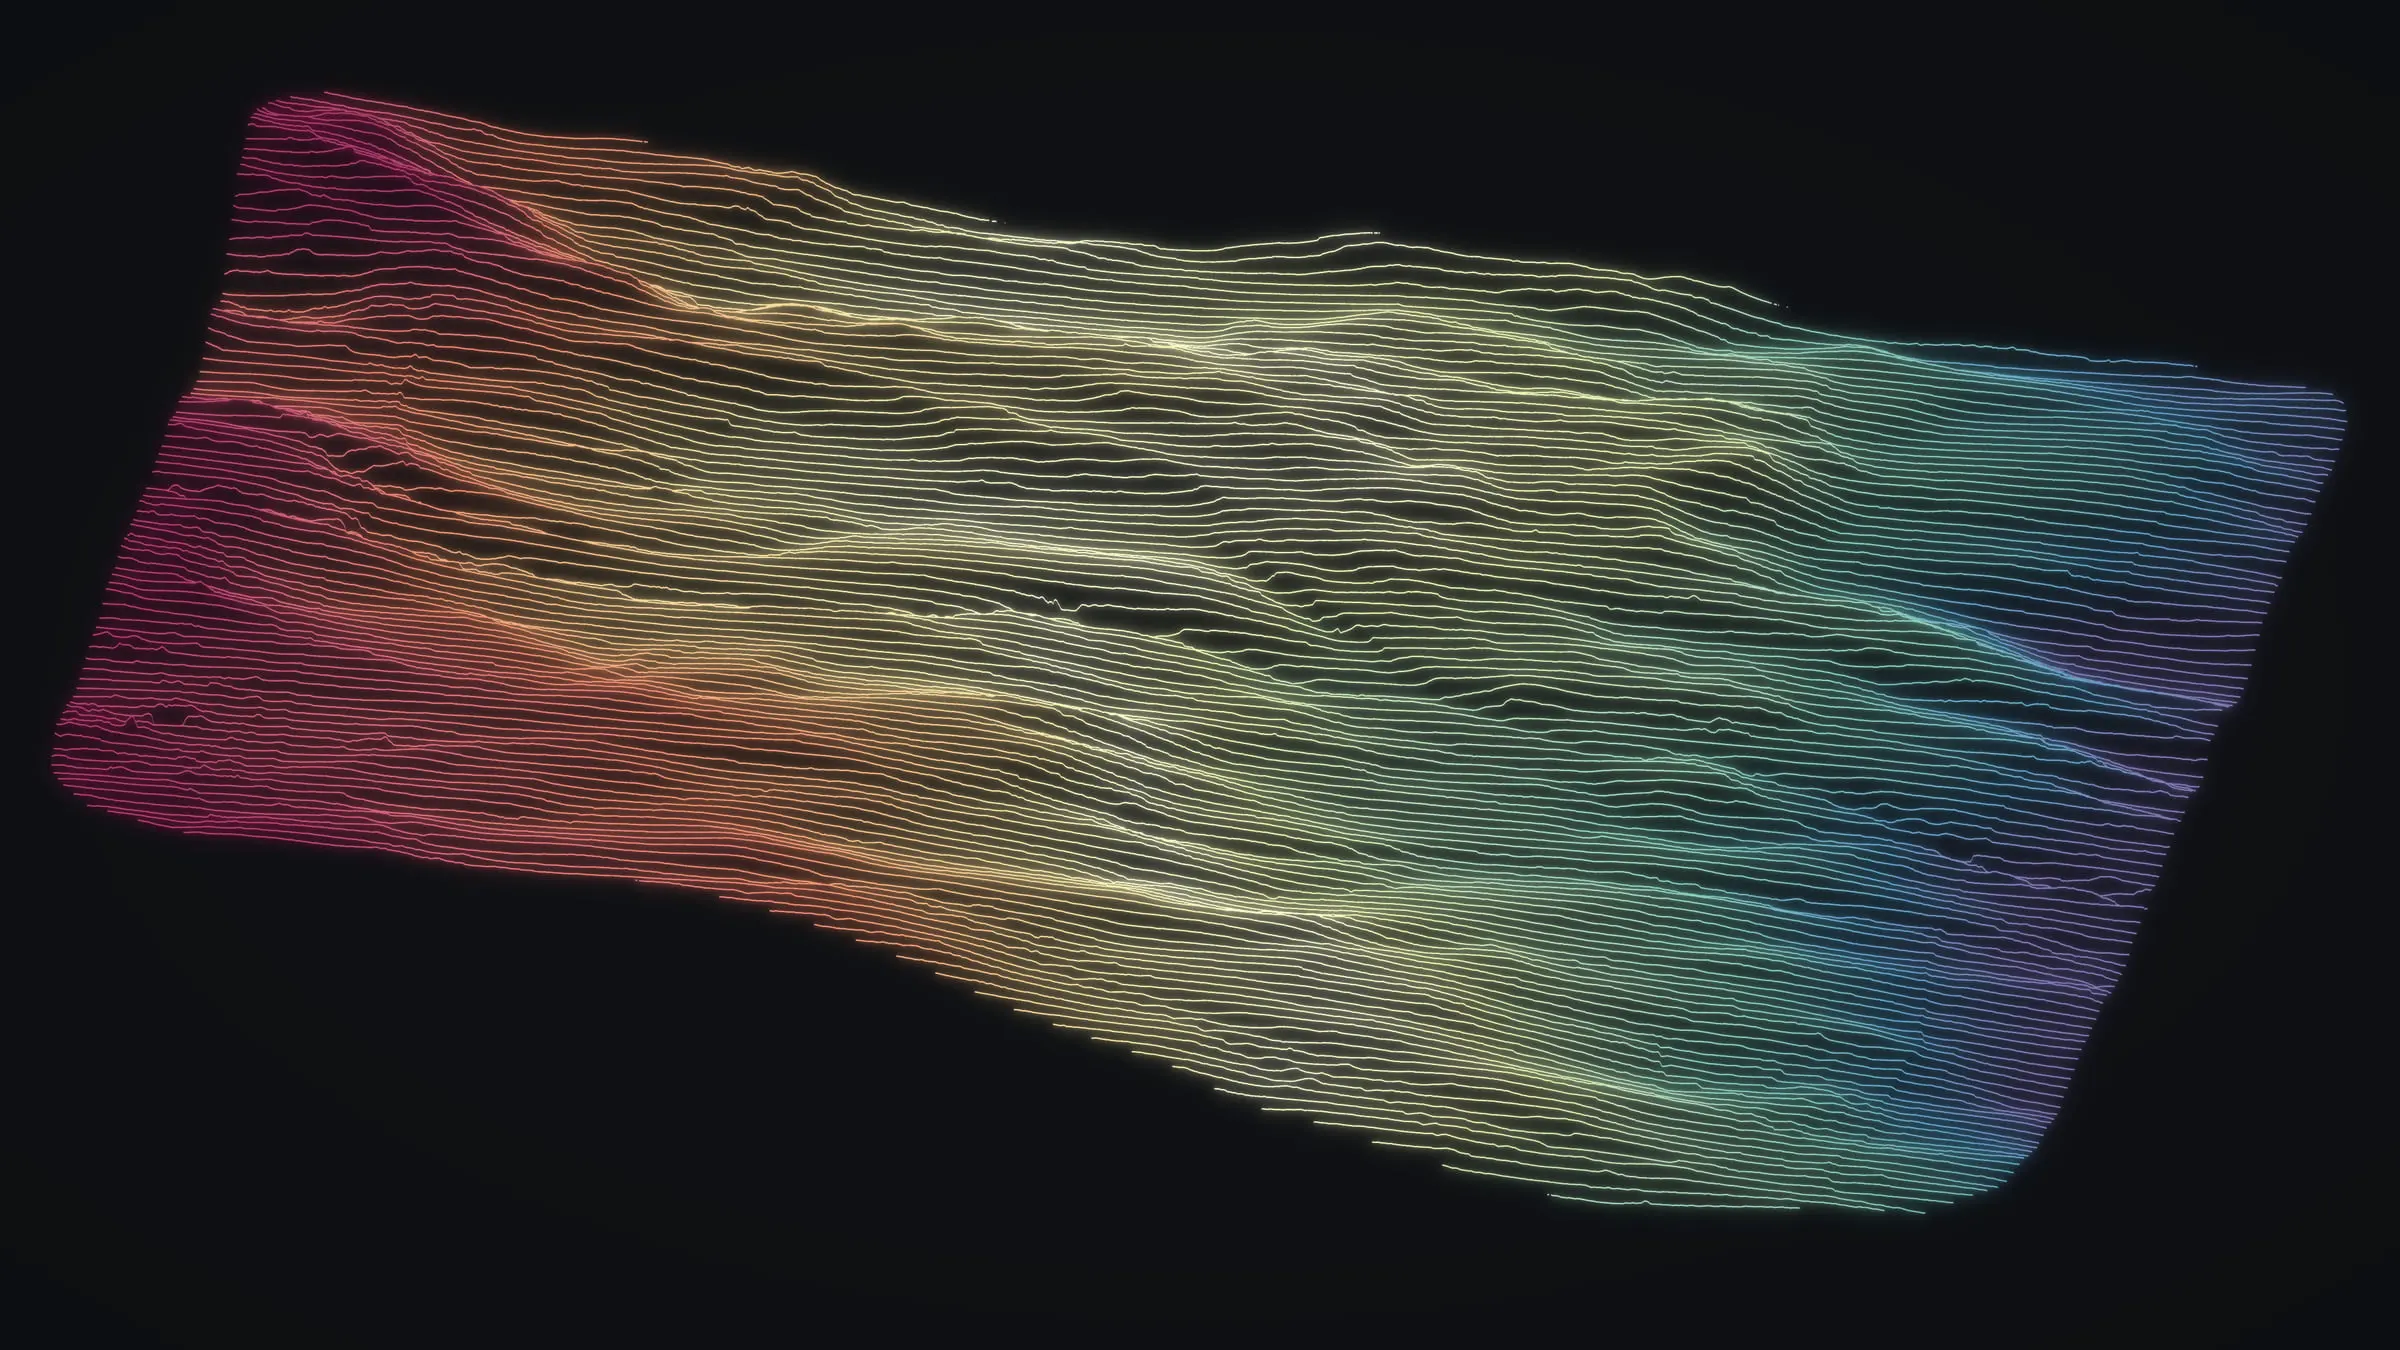
Case study · farms and terrain
Farm planning data on Maui, from Kula to Haʻikū
In August 2025 we flew two Maui farm sites with drone LiDAR and a camera: about 105 acres of dry, gullied slope at Kēōkea in Upcountry Kula, and 8.5 acres around a small farm parcel in Haʻikū on the windward side. Both flights produced bare earth, contours and canopy height, the ground a farm plan starts from.
Two Maui farms, in their own data
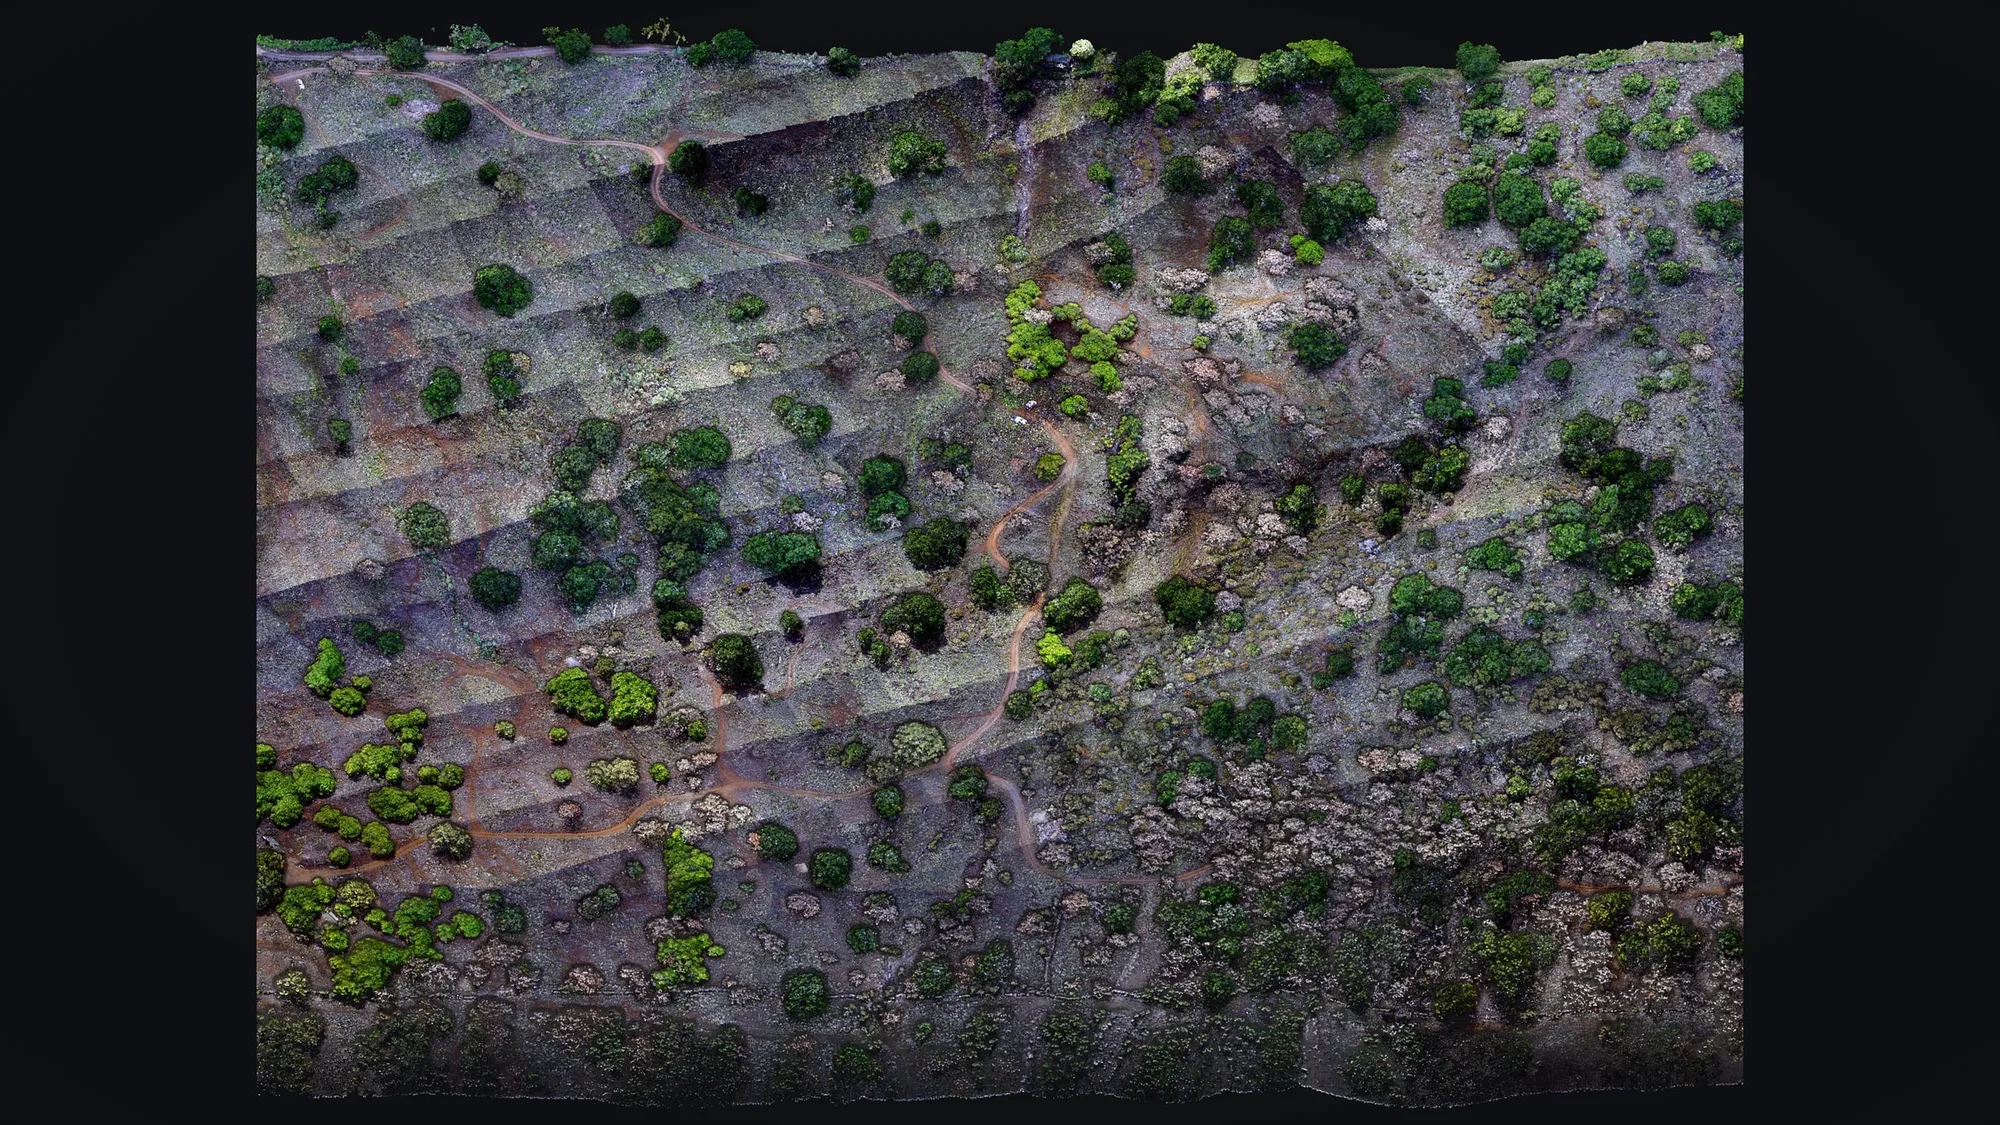
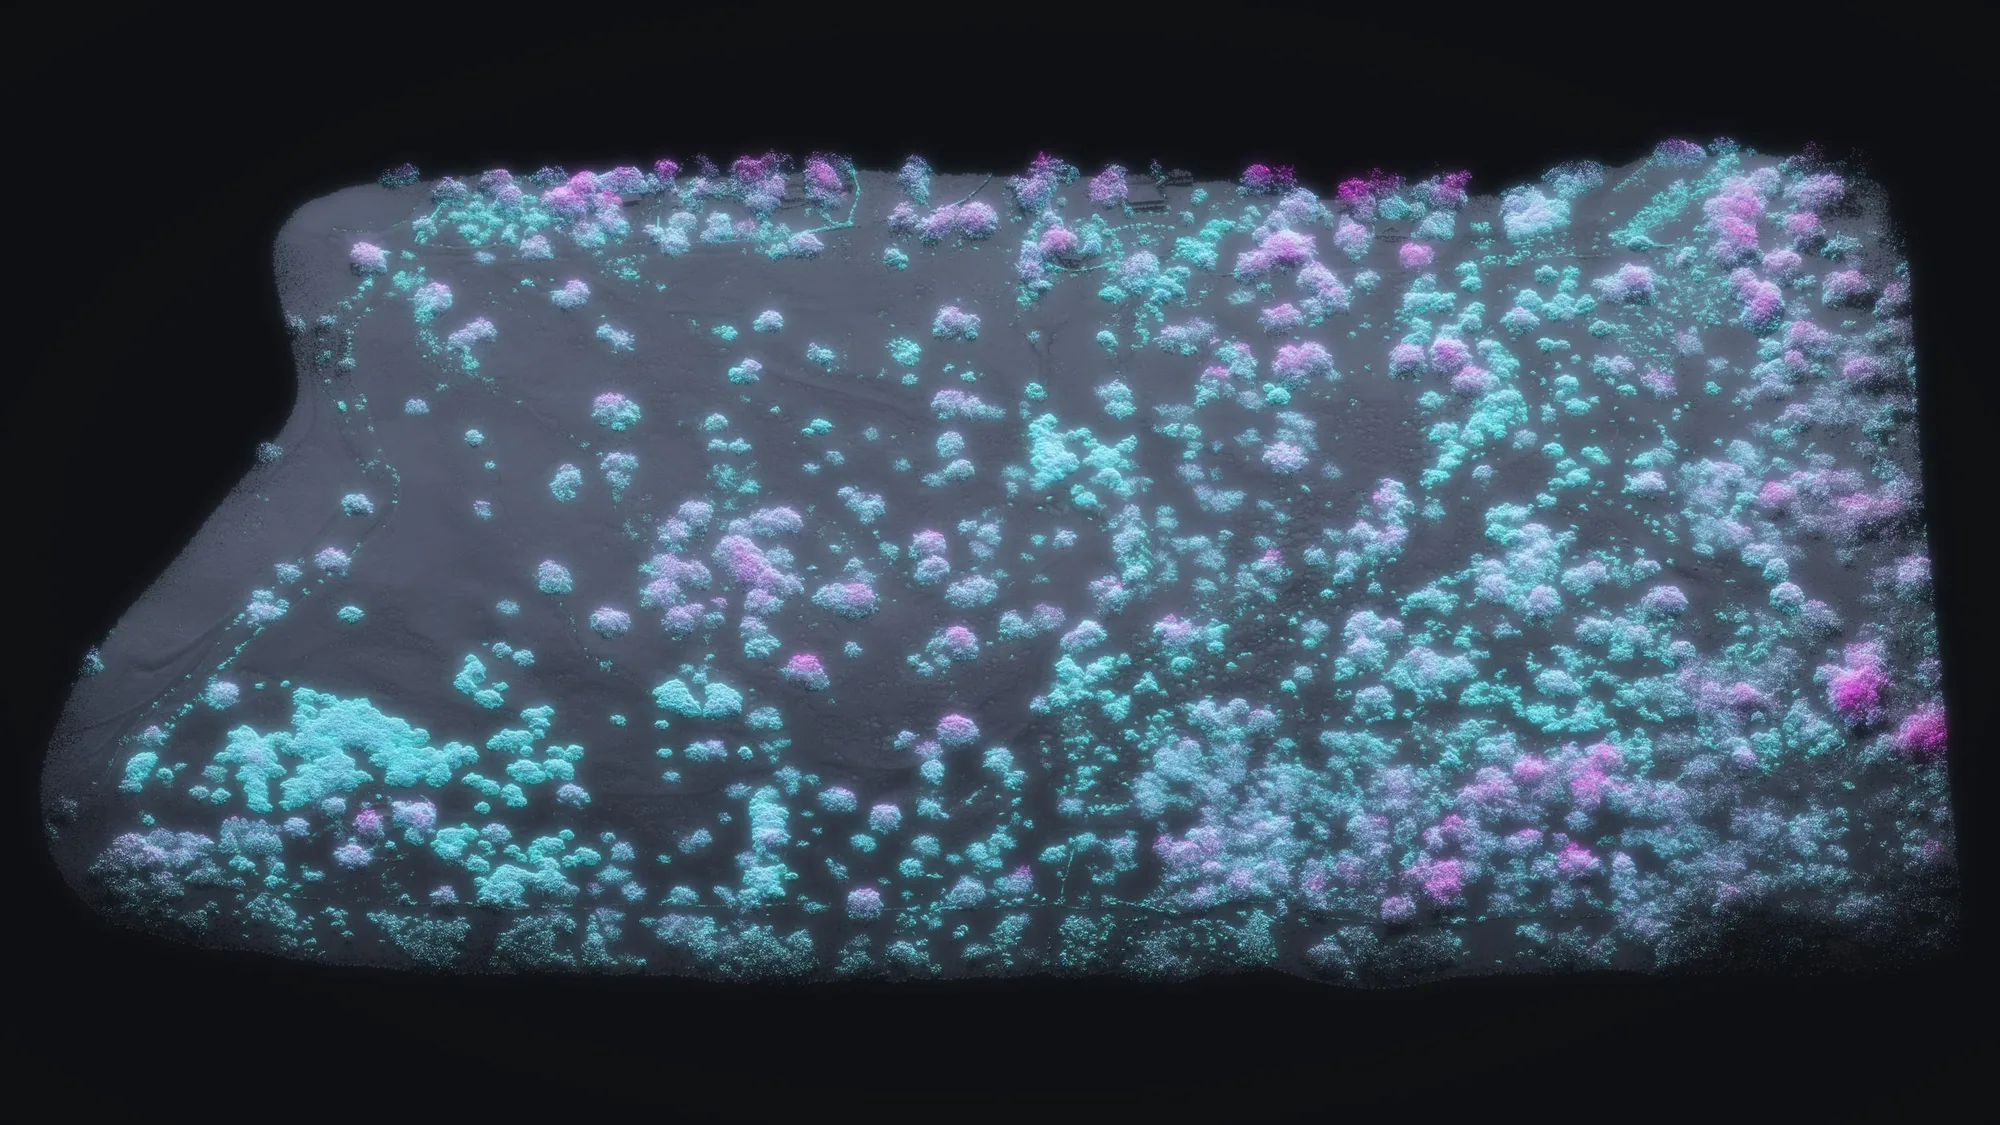
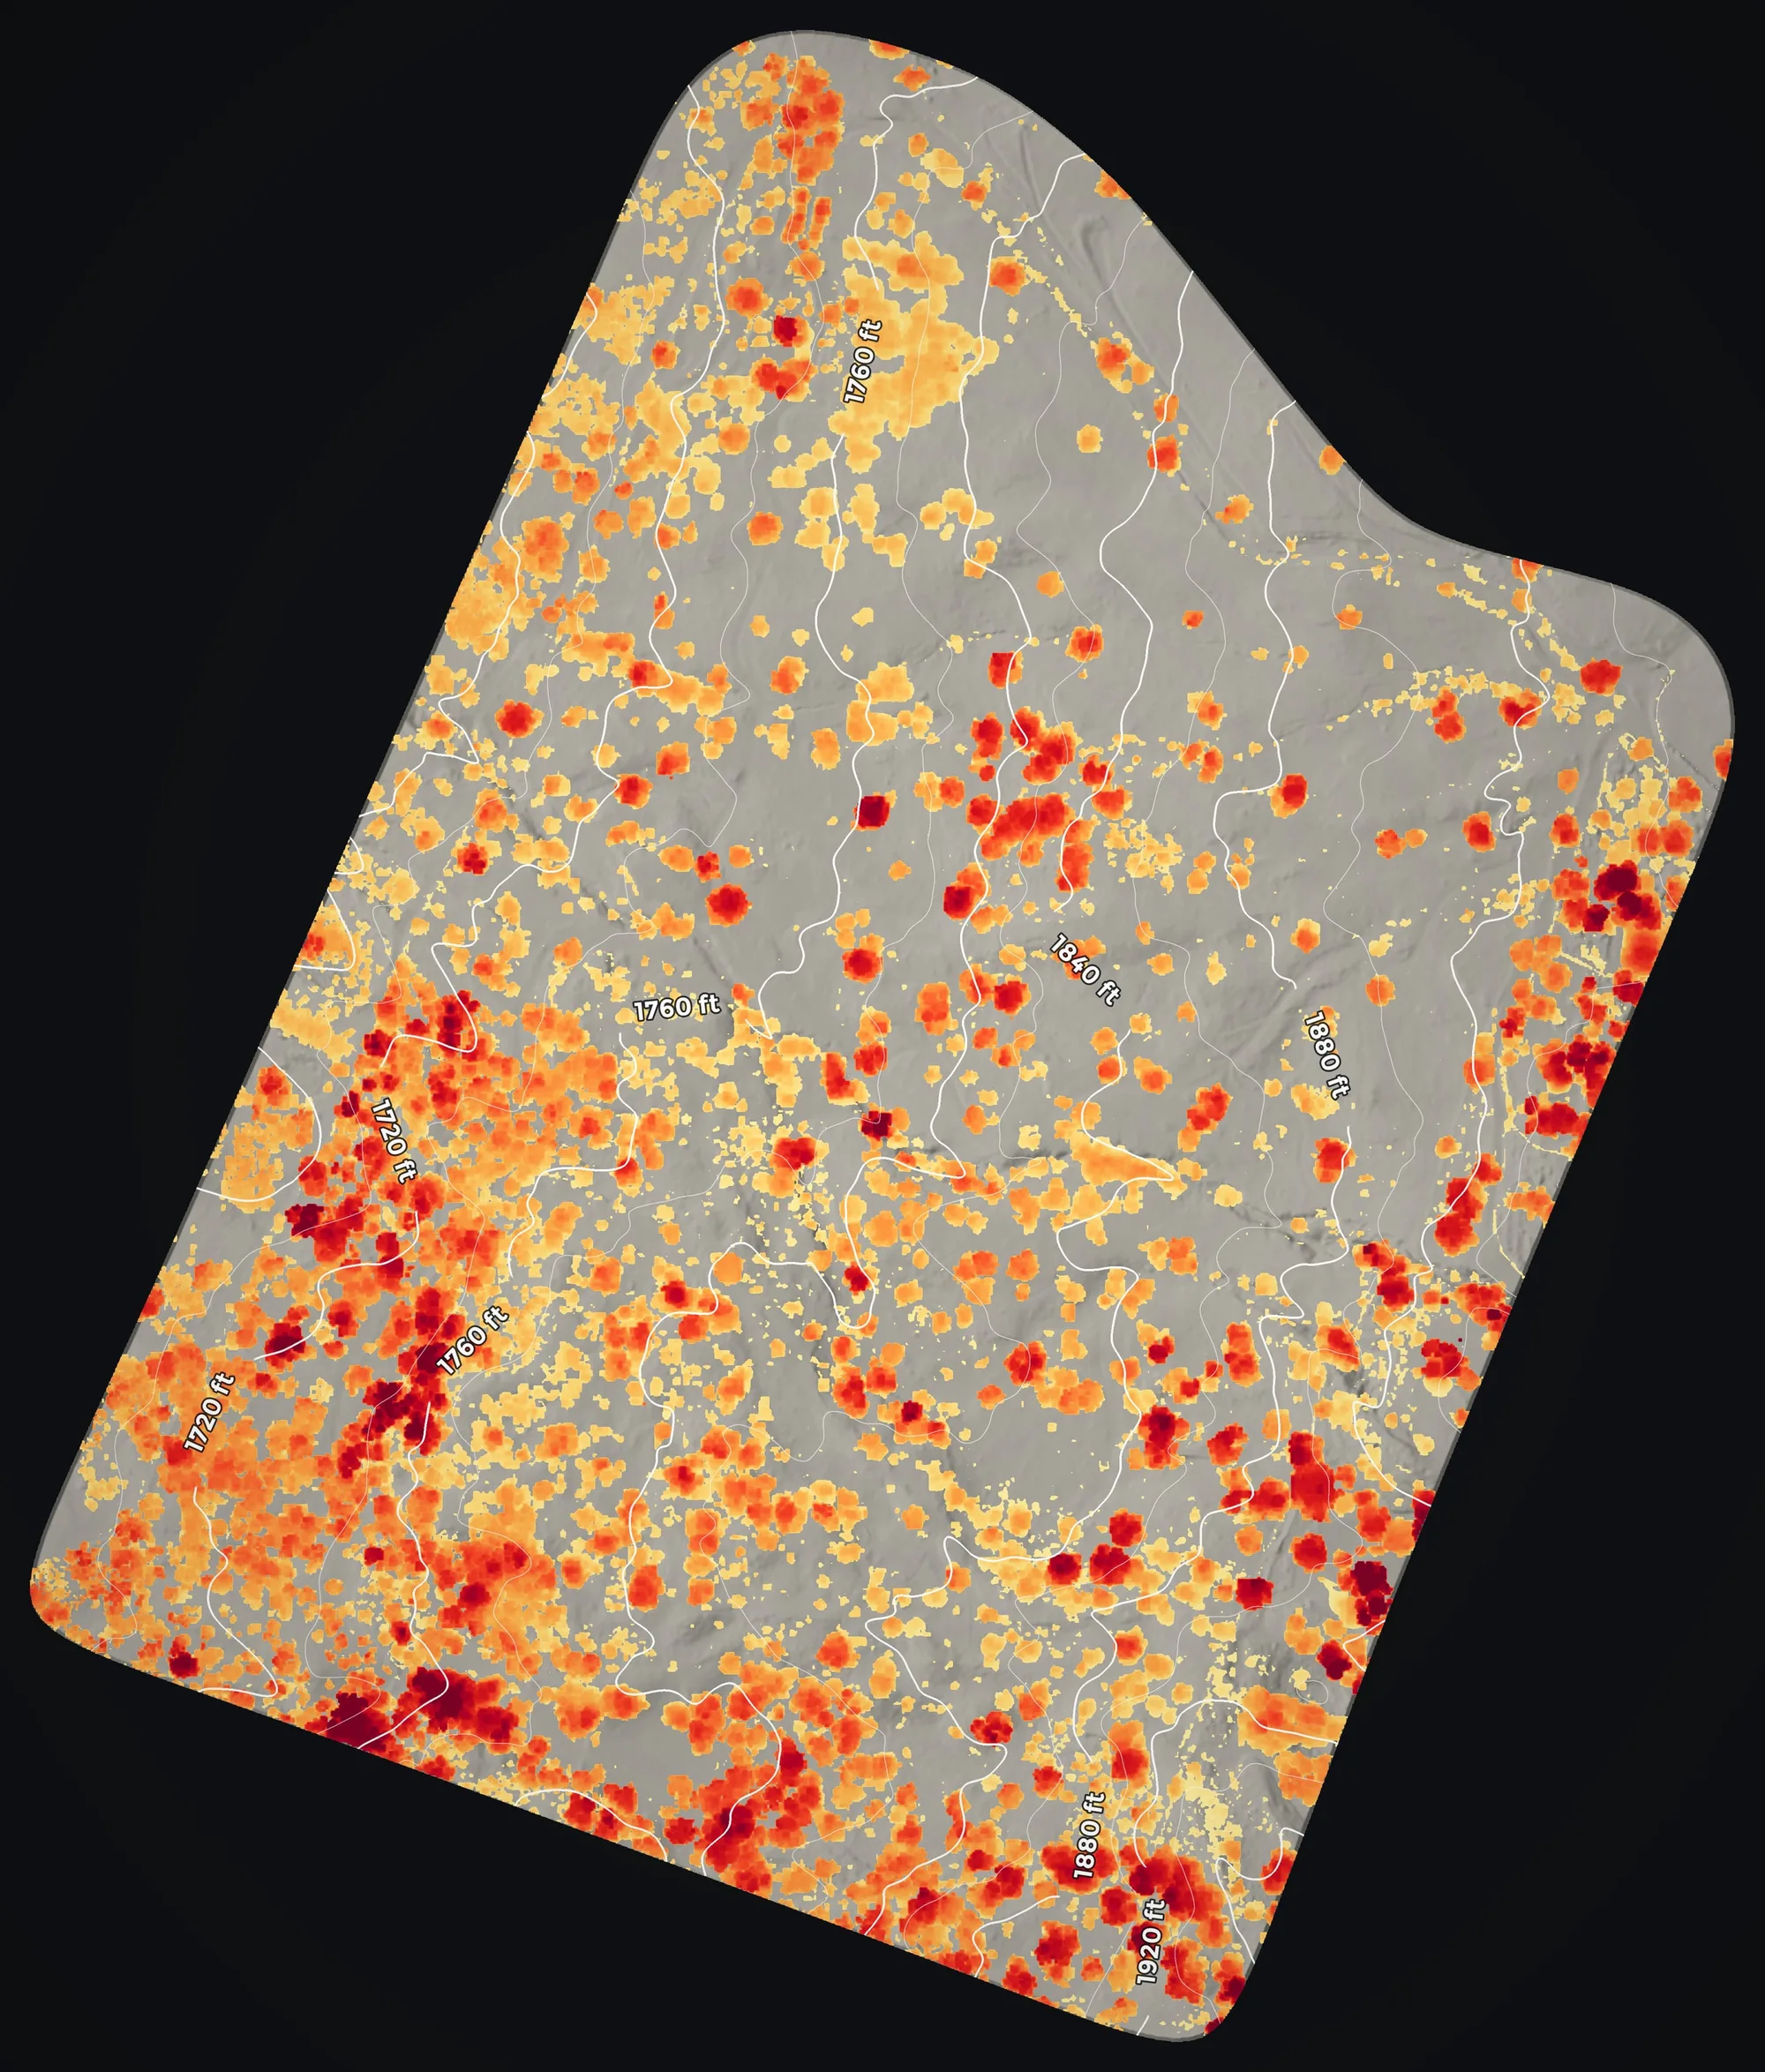
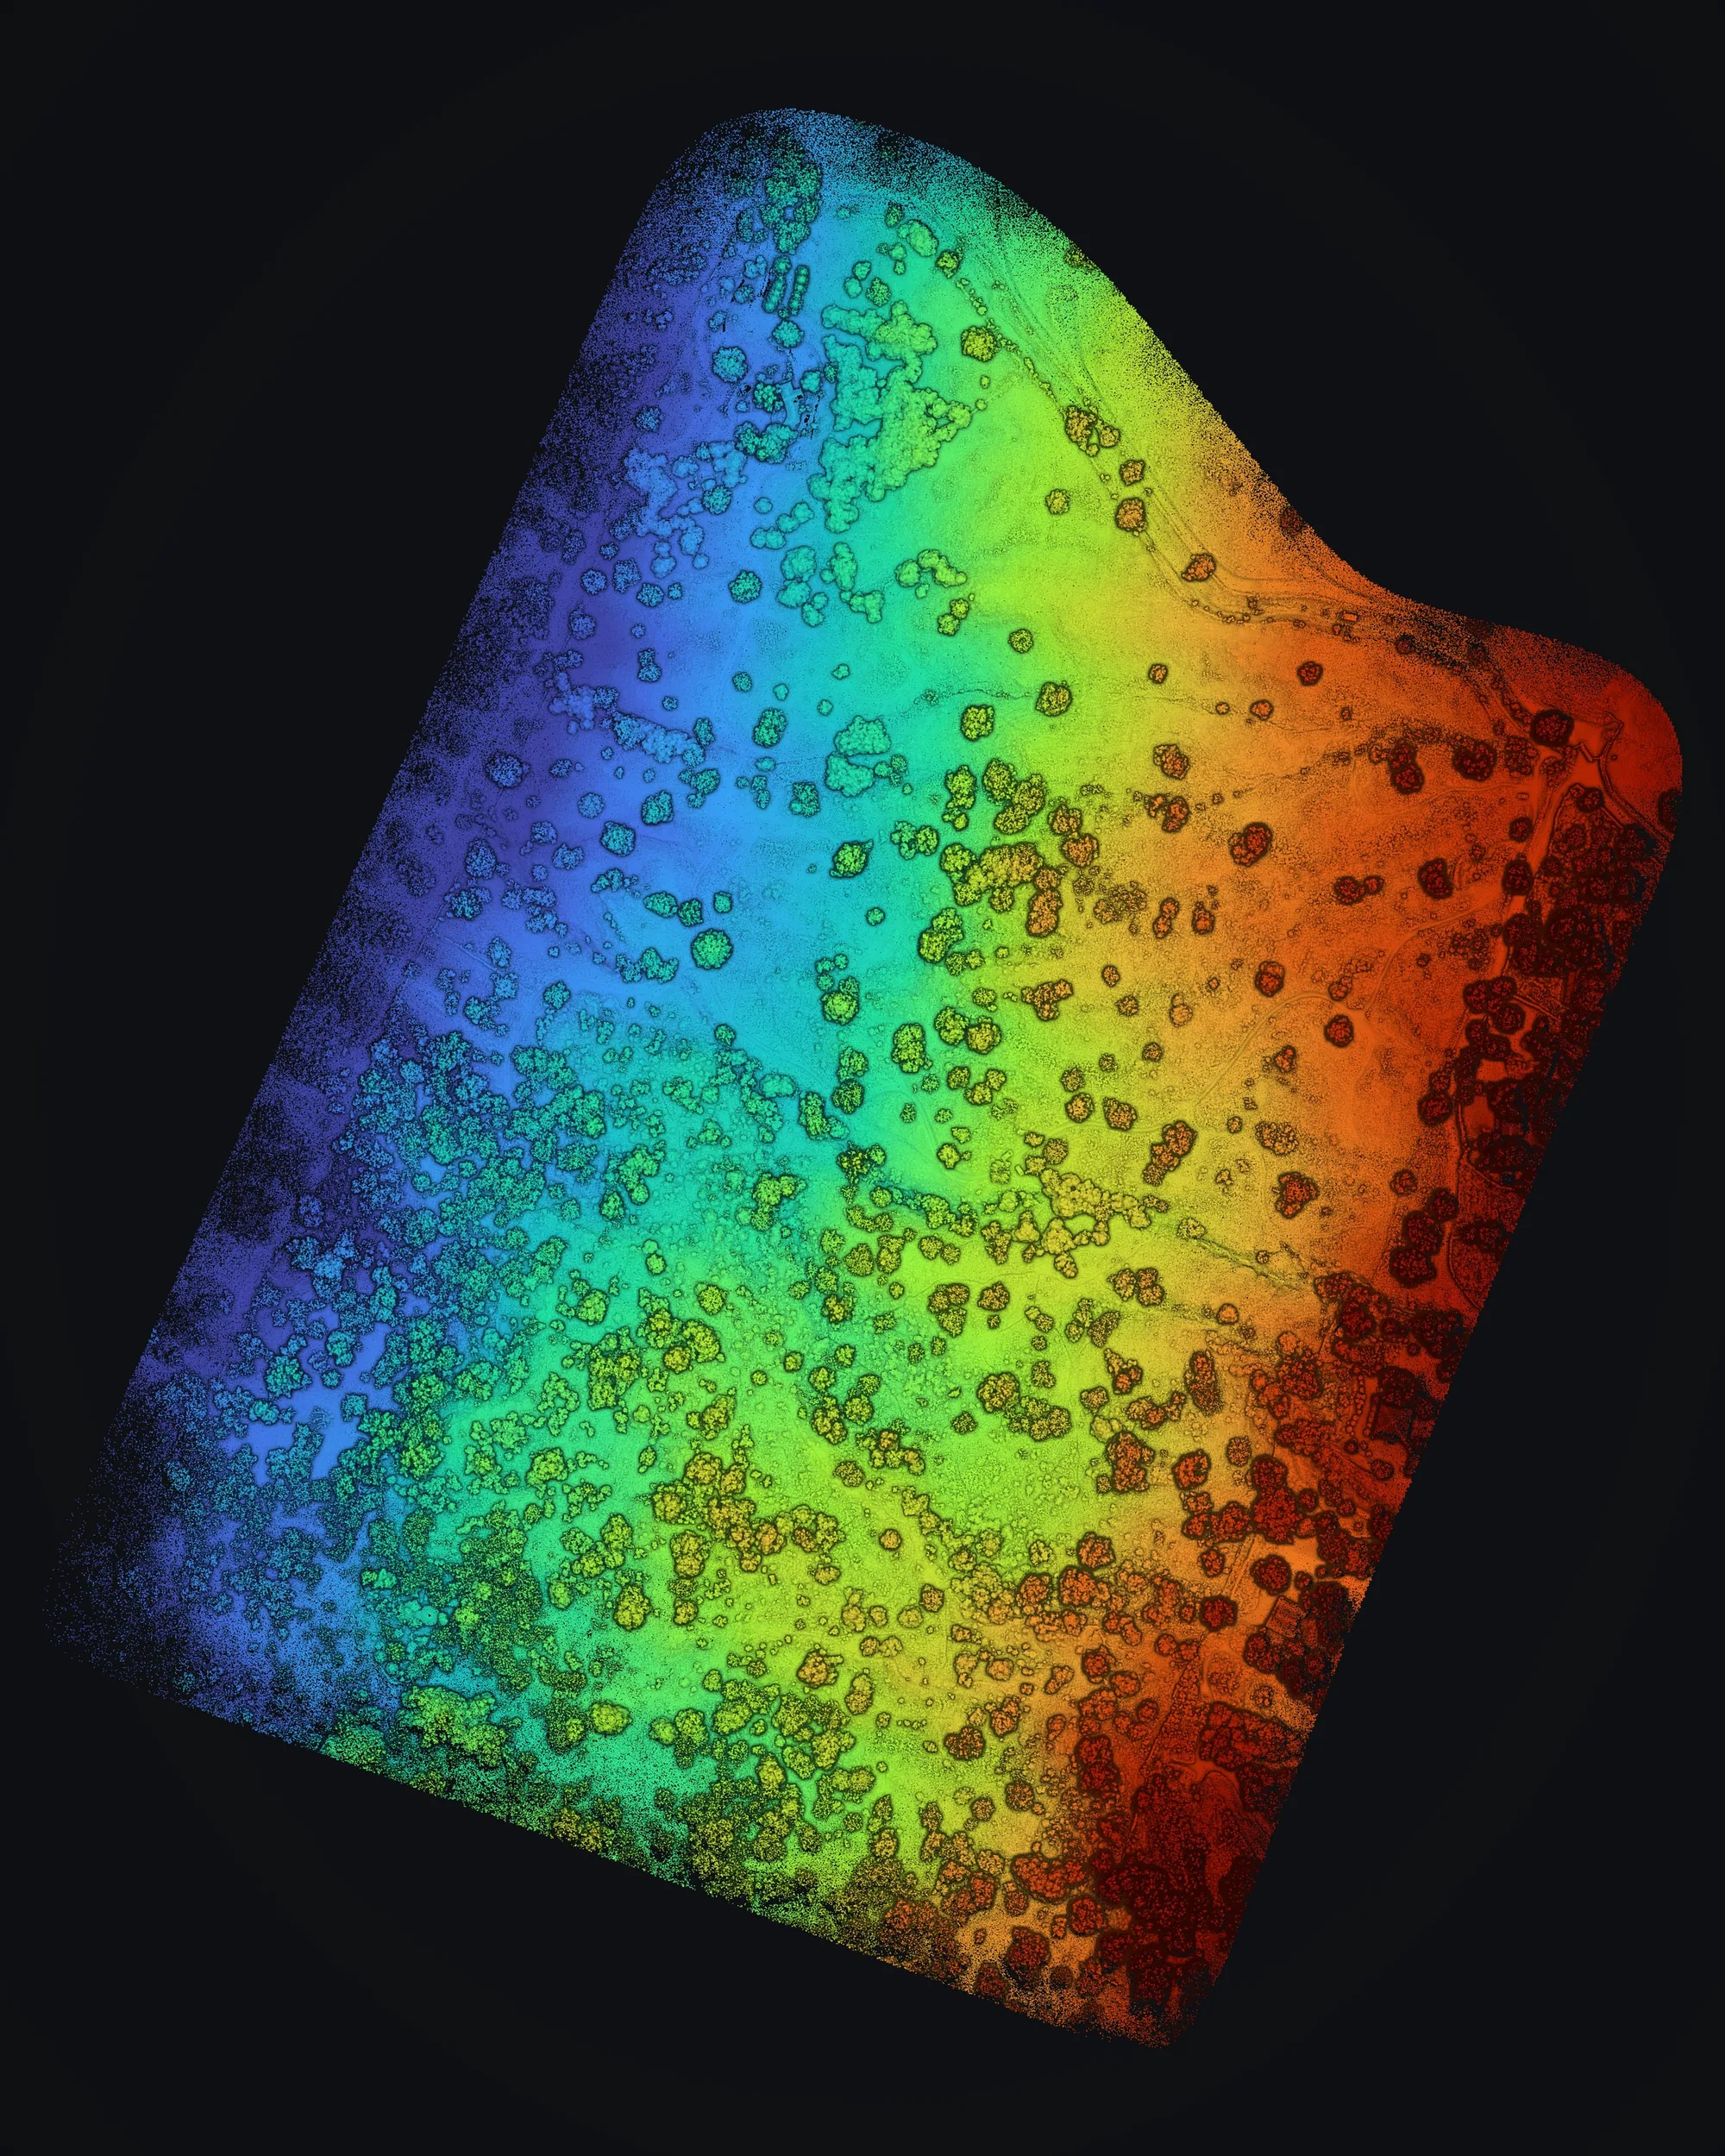
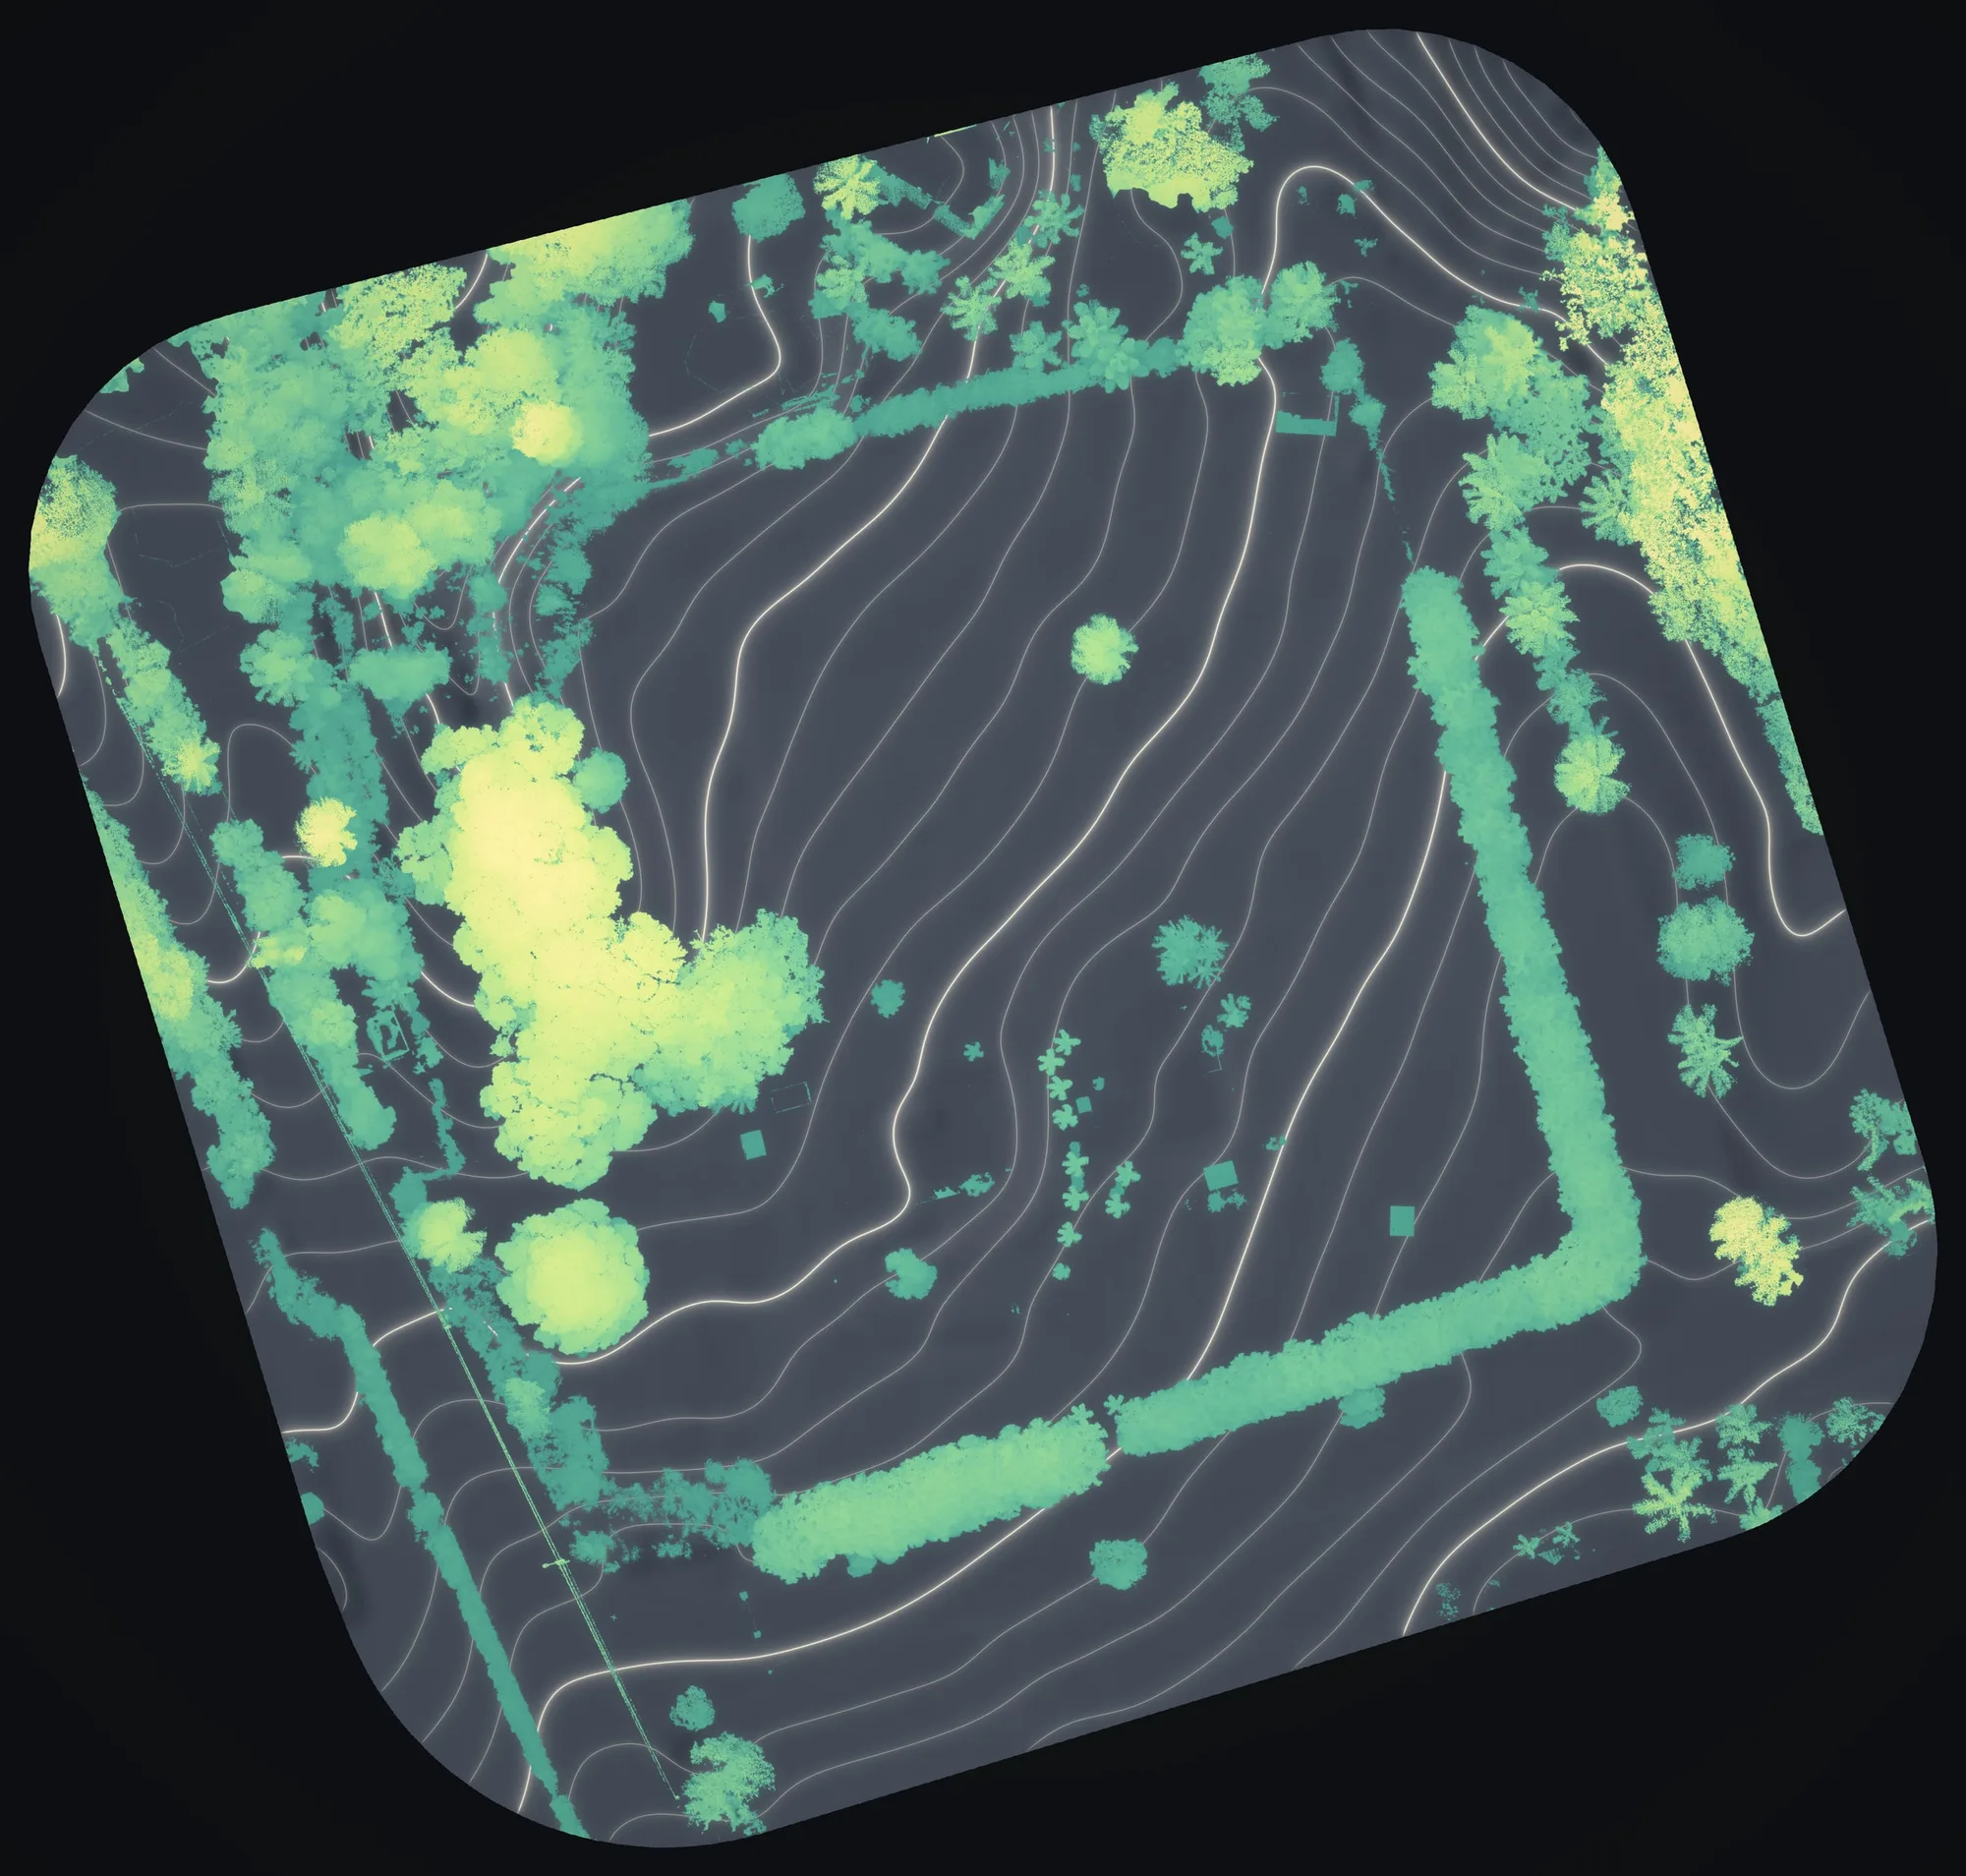
Kēōkea in Upcountry Kula and a flower farm in Haʻikū. Select a picture to open it at full size.
The problem
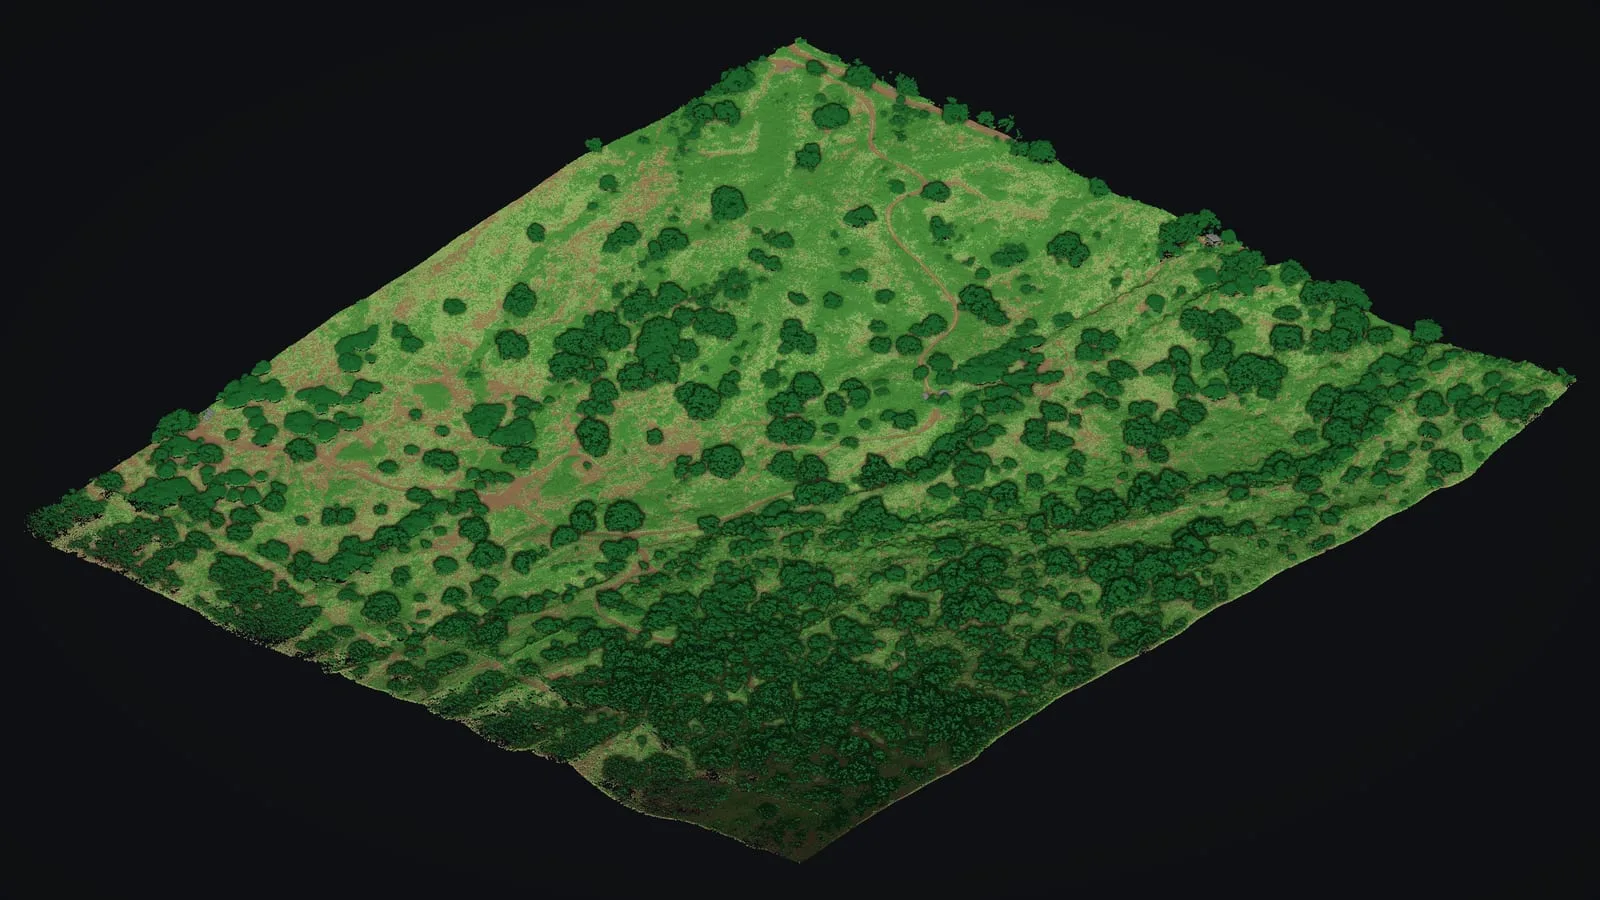
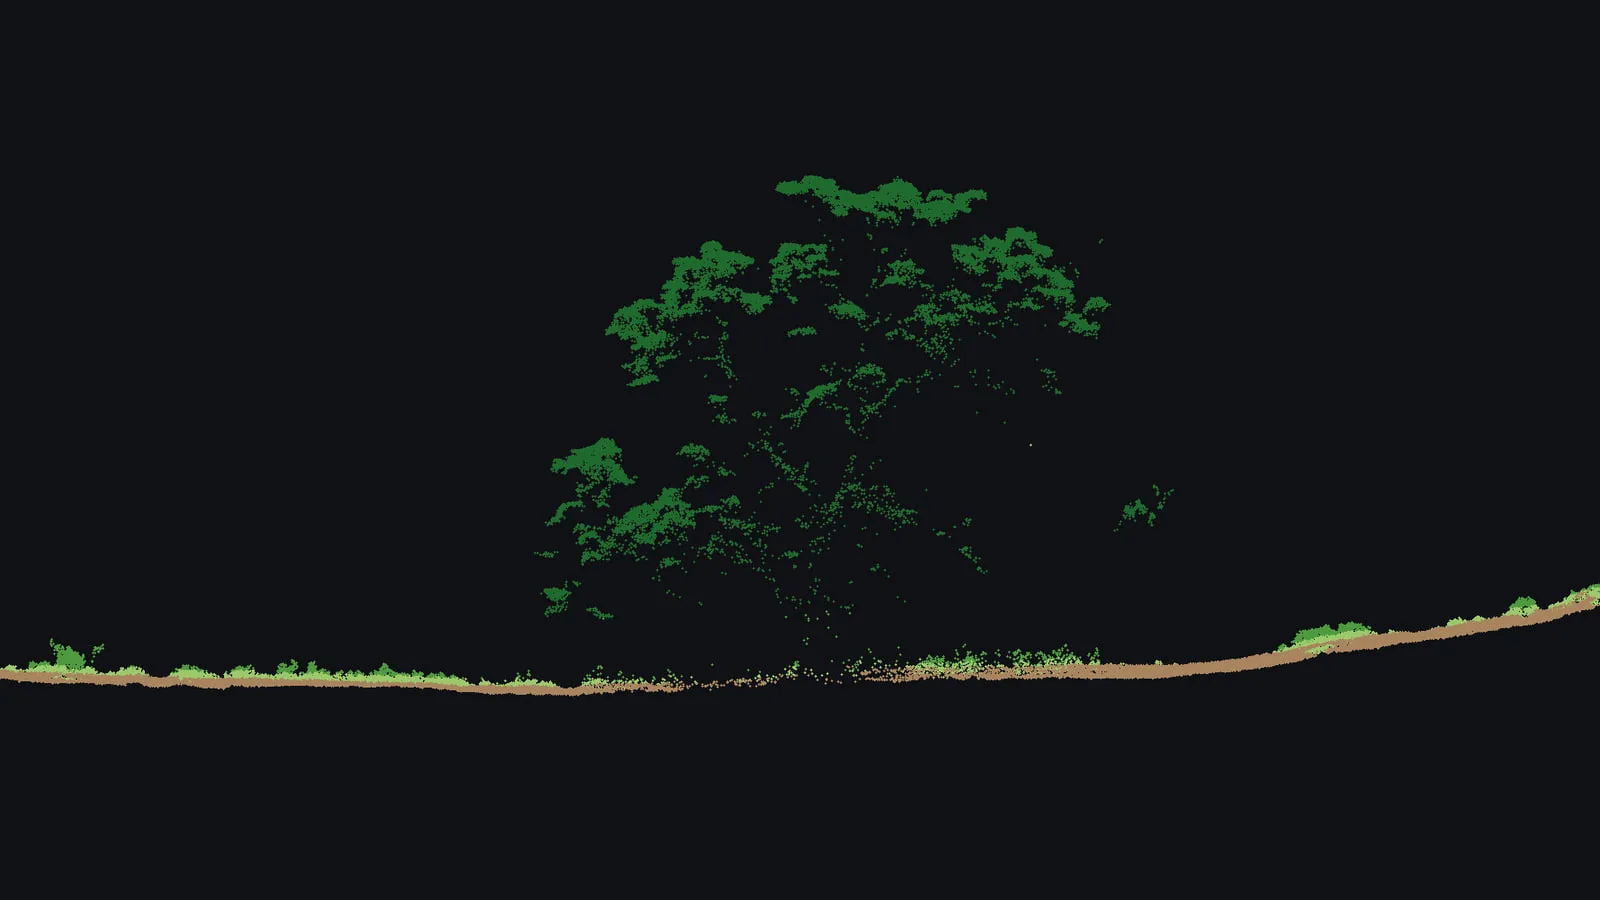
A farm plan puts fields, tracks and a house onto real ground, and on Maui that ground is seldom simple. Where does the slope fall away, how steep are the gullies, and what is already growing there? A photograph shows the scrub, hedgerows and trees. Drone LiDAR also reaches through the gaps between them to the ground underneath, so a plan can be drawn on the land itself.
Kēōkea, in Kula
What we flew
We flew Kēōkea on the morning of August 6, 2025, in a single drone LiDAR mission, with a camera taking 1,016 photos alongside and a GNSS base station logging on site for processing. The mapped area covers about 105 acres of dry, scrubby ground cut by gullies, and the land falls about 310 ft from top to bottom.
What we delivered
- A classified point cloud of 306,035,261 points
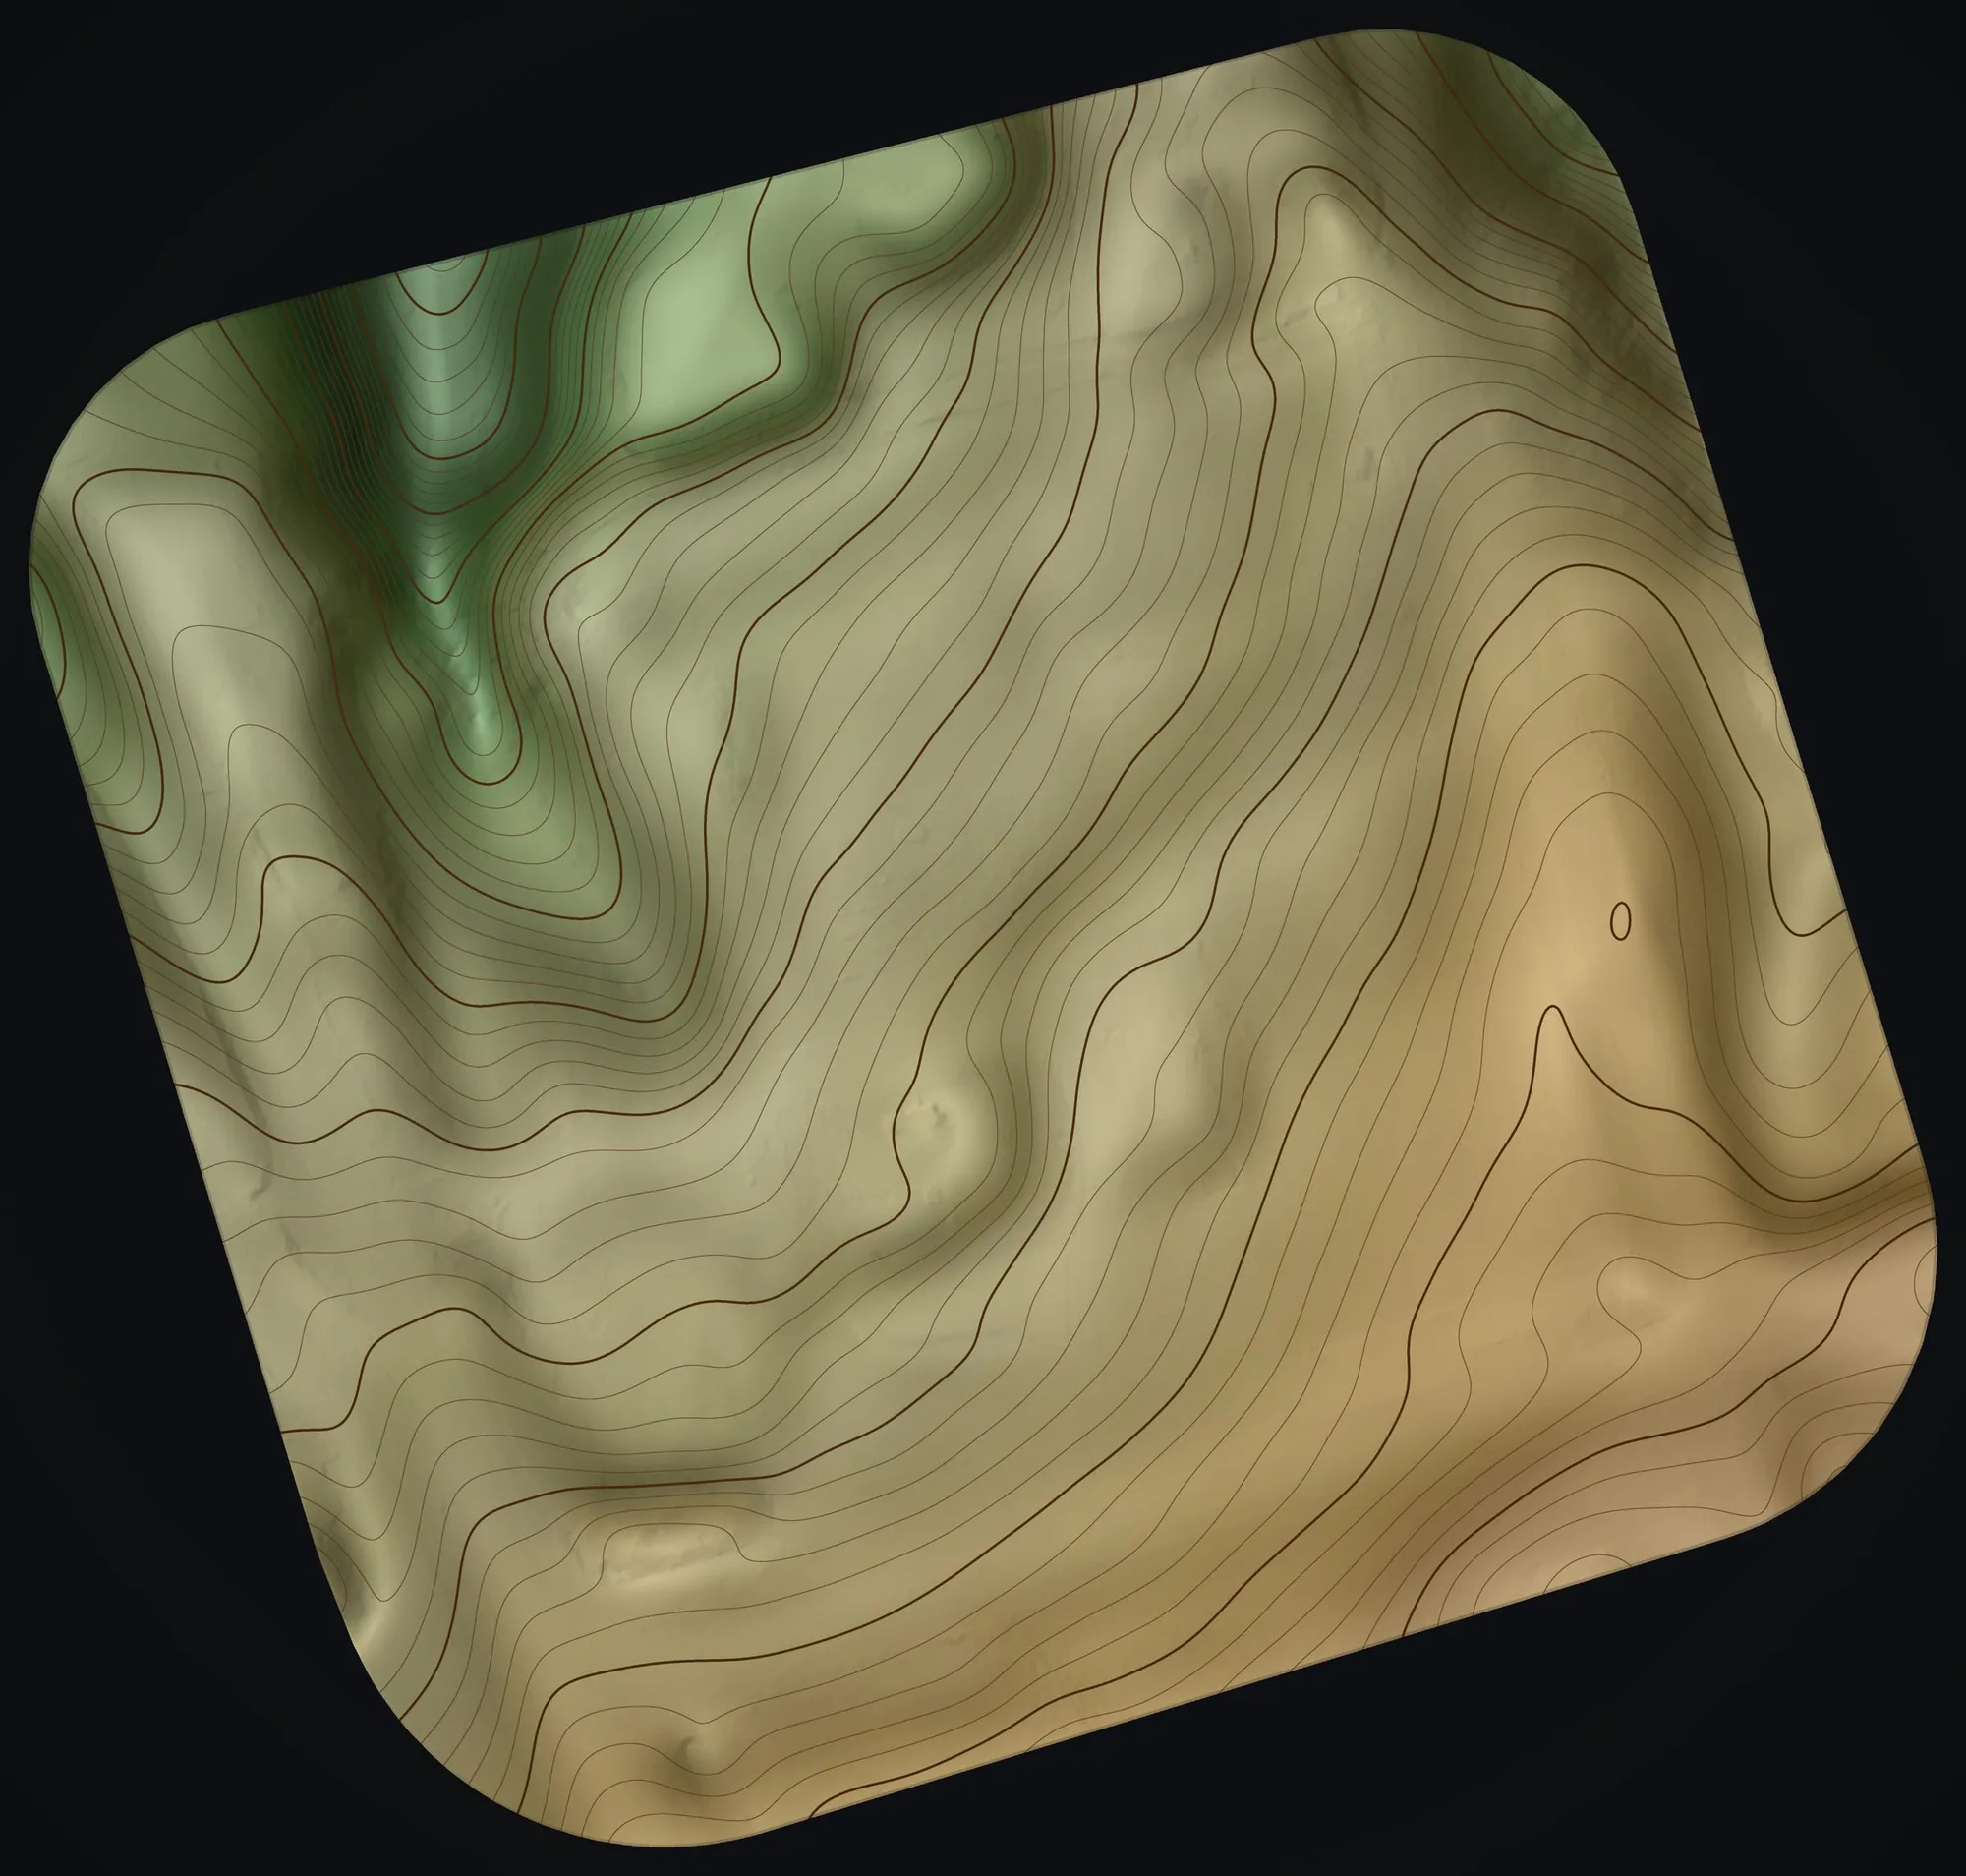
- A bare earth model on a 25 cm grid, plus surface and canopy height models and a hillshade
- An orthomosaic with a 1.7 cm pixel
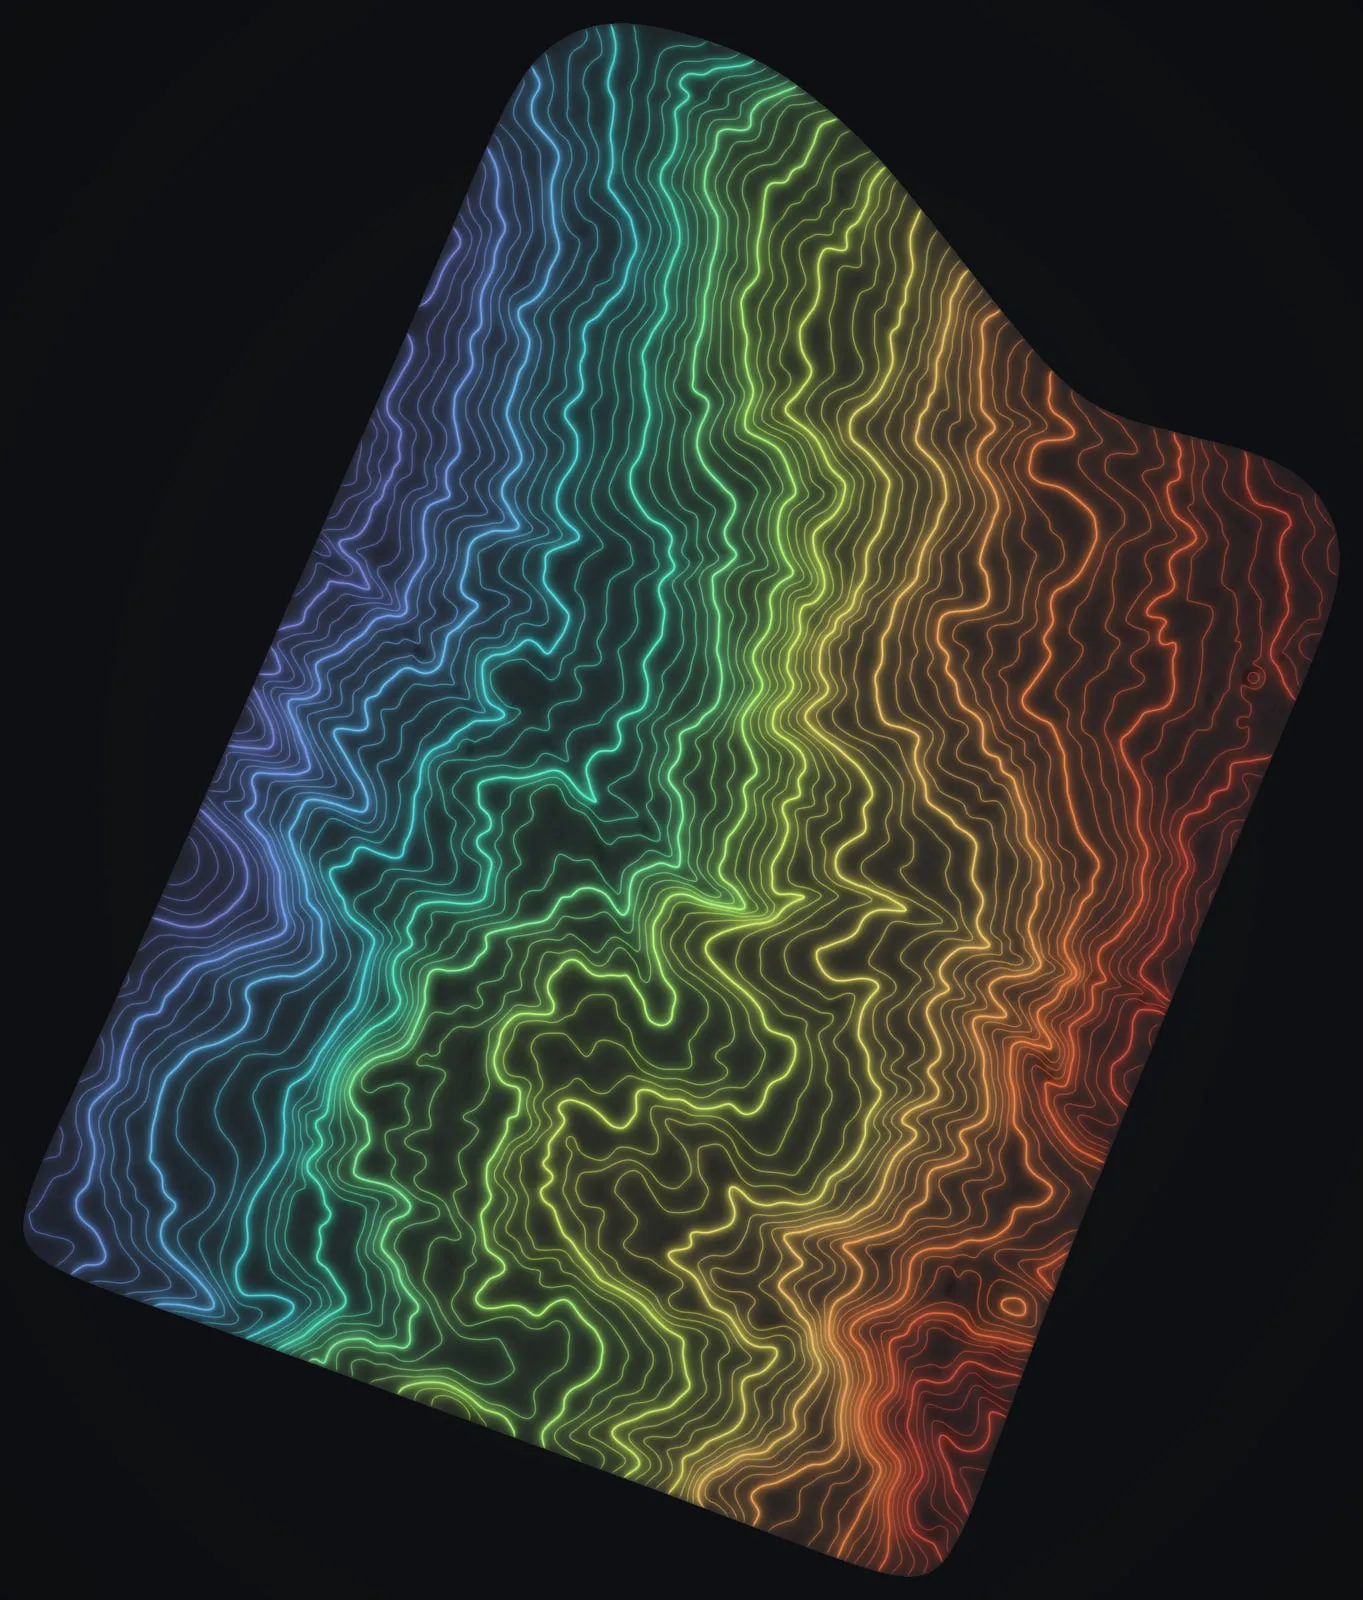
- Contours every 1 ft as AutoCAD DWG and shapefile, and every 5 ft in DWG, added in January 2026
- Six 11 x 17 map sheets as PDFs: the orthomosaic and the hillshade, each with and without contours, a color hillshade and canopy height
- The rasters and the contour shapefile on NAD83(PA11), in State Plane zone 2, the zone that covers Maui
What it was used for
The plan is the landowner's own. After delivery they drew it on our sheets and sent back marked up copies: a field outlined on the orthomosaic sheet, and a home site inside that field marked on the contour sheet. Our part was the ground the plan was drawn on.
Haʻikū
What we flew
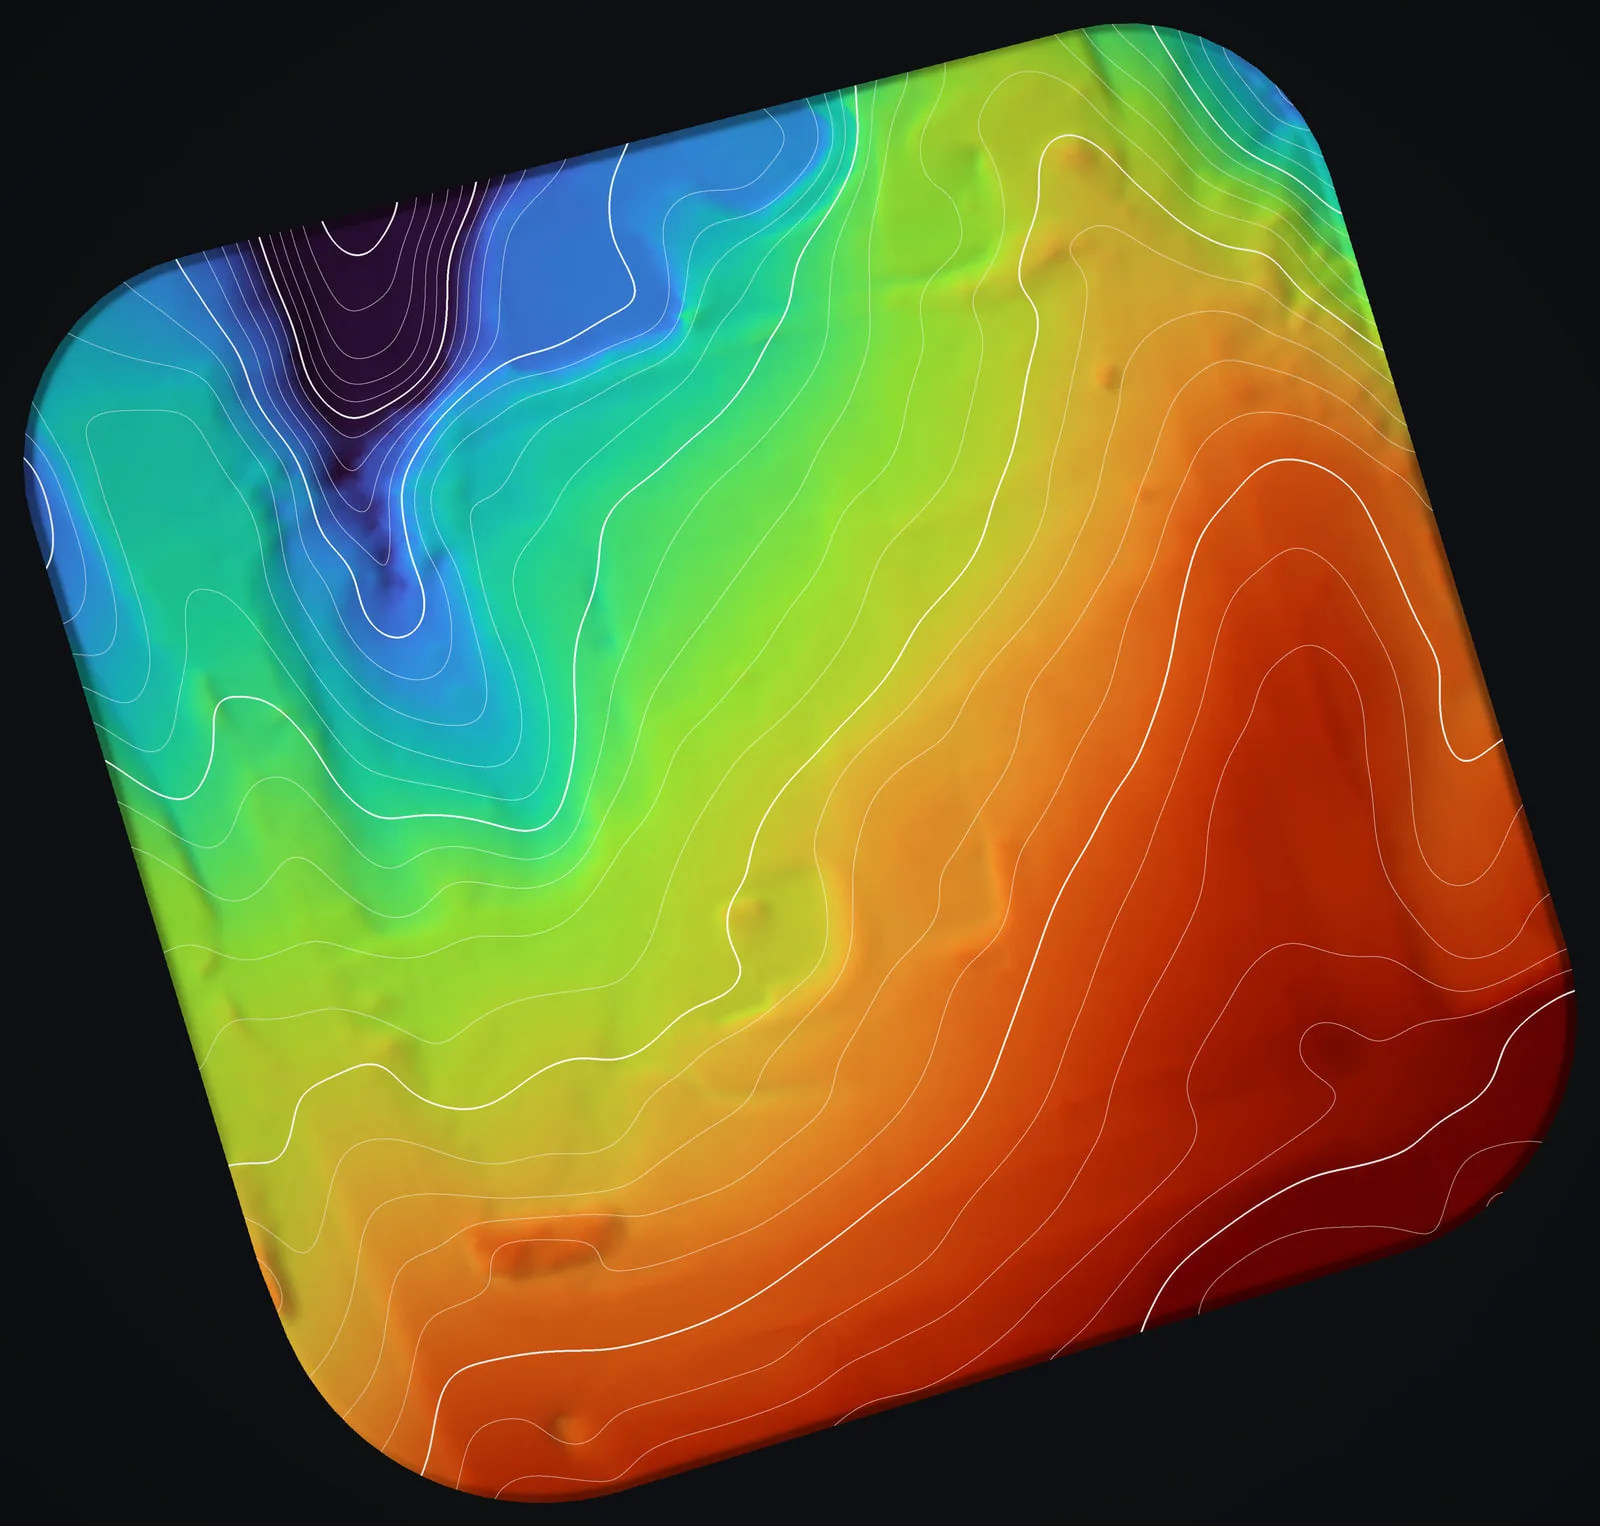
Two days later, on August 8, 2025, we flew a small farm parcel in Haʻikū and the land around it, 8.5 acres in all, with drone LiDAR, a camera taking 280 photos and a GNSS base on site. The ground there rises 68 ft from its lowest point to its highest.
What the flight produced
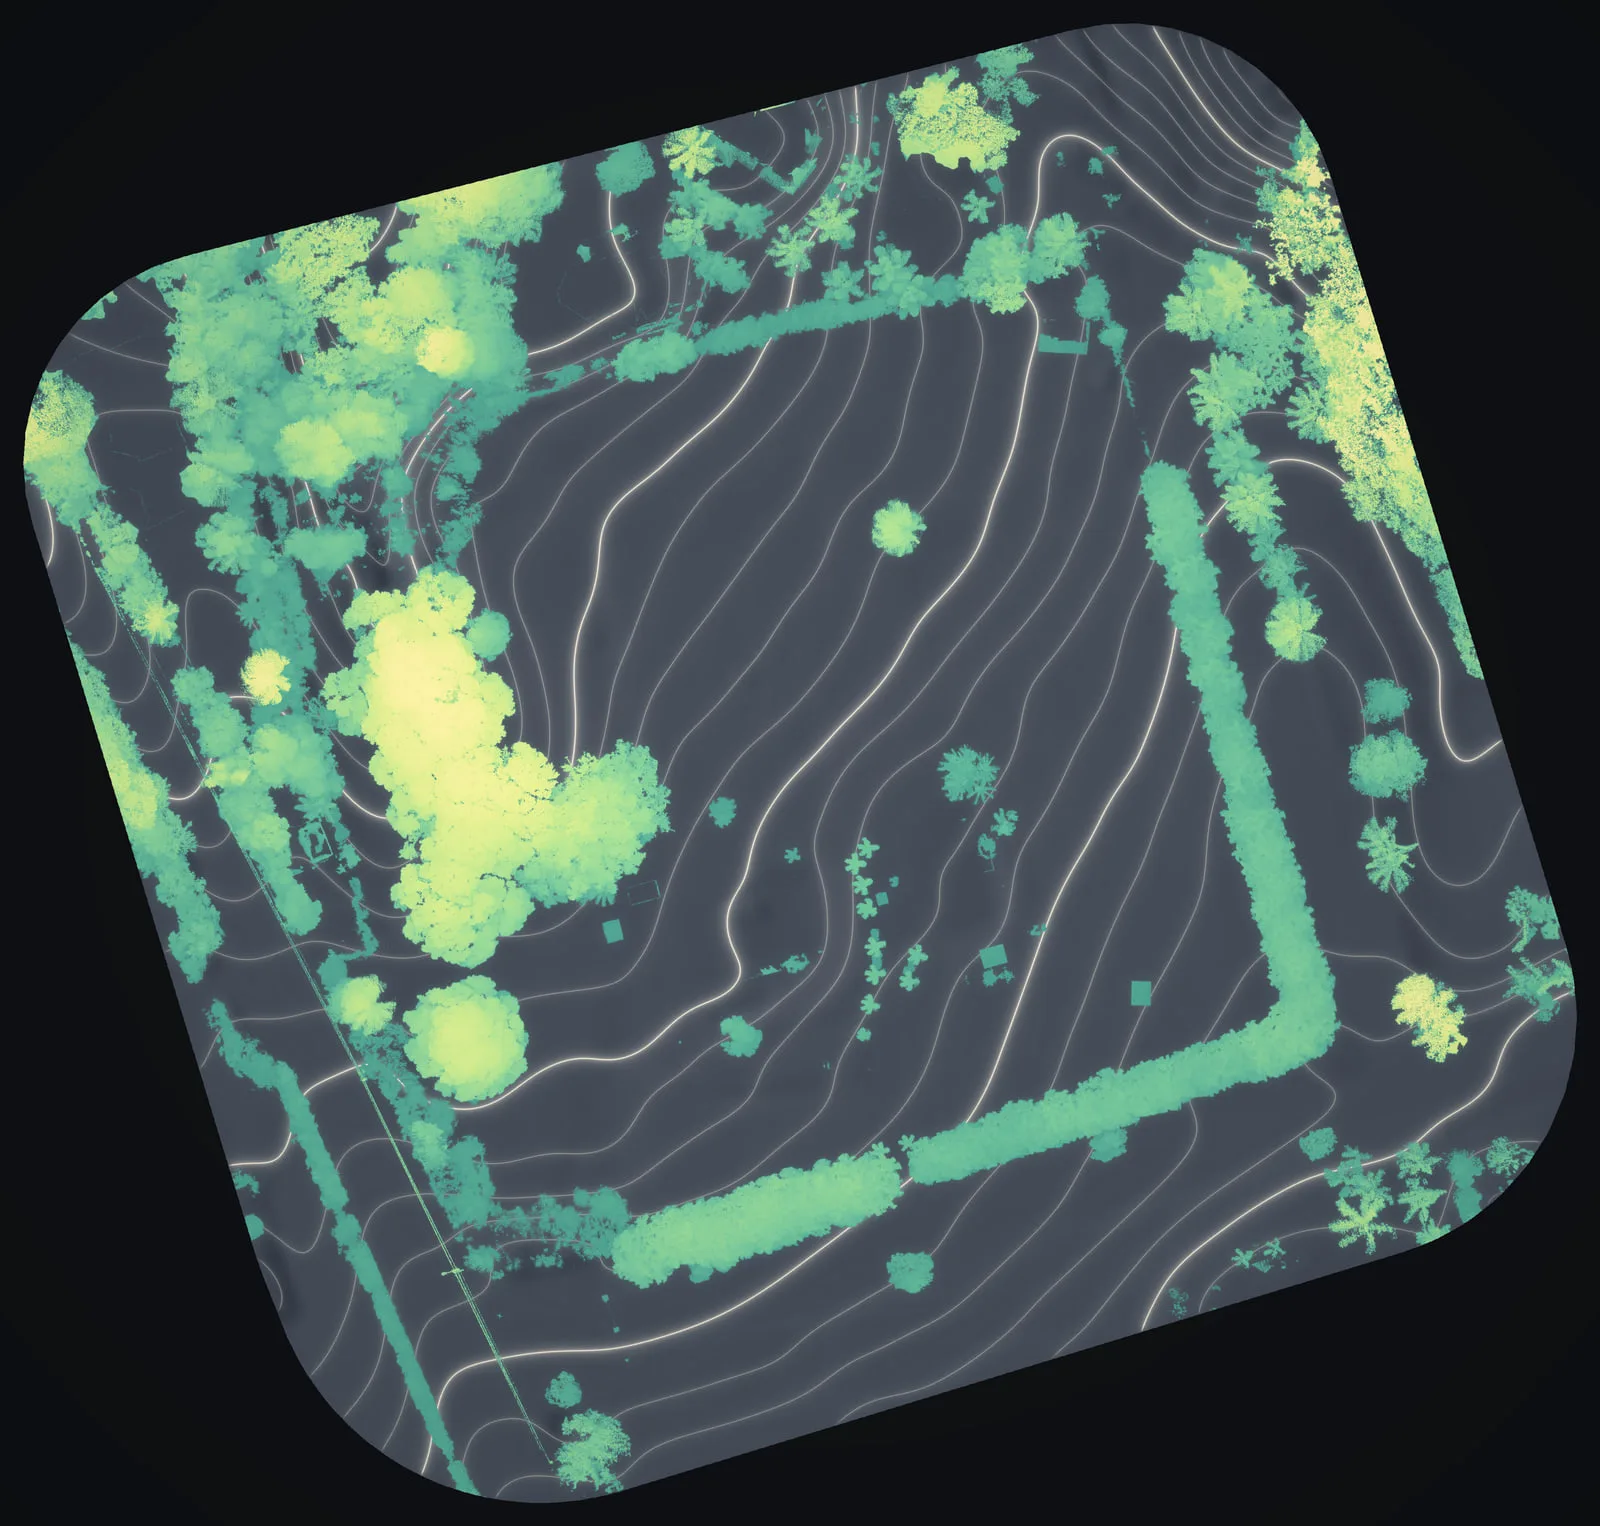
The camera frames became an orthomosaic at 1.2 cm. The LiDAR became three models on a 5 cm grid, for bare earth, the surface and canopy height, along with a hillshade and contours every 1 ft drawn from the bare earth and clipped to the parcel. The canopy model puts 29 percent of the area under trees and hedges taller than 6 ft, and it picks out the hedgerows that ring the field.
The numbers
Kēōkea
- acres mapped
- 105.5
- points in the classified cloud
- 306,035,261
- orthomosaic pixel
- 1.7 cm
- feet of fall, top to bottom
- about 310
- map sheets delivered
- 6
- contour intervals delivered
- 1 and 5 ft
Haʻikū
- acres mapped
- 8.5
- orthomosaic pixel
- 1.2 cm
- feet of relief, top to bottom
- 68
- percent under canopy over 6 ft
- 29
Fall and relief are measured inside each site's own bare earth model, low point to high point. They are not elevations.
Related work and services
Planning farm ground of your own?
Send the island, where the land sits, about how many acres and what the plan is for: fields, a home site, fencing or planting. We will say what the flight would give you before anyone flies.