
Case study · sea cliff baseline
Cliffside erosion monitoring on the Big Island
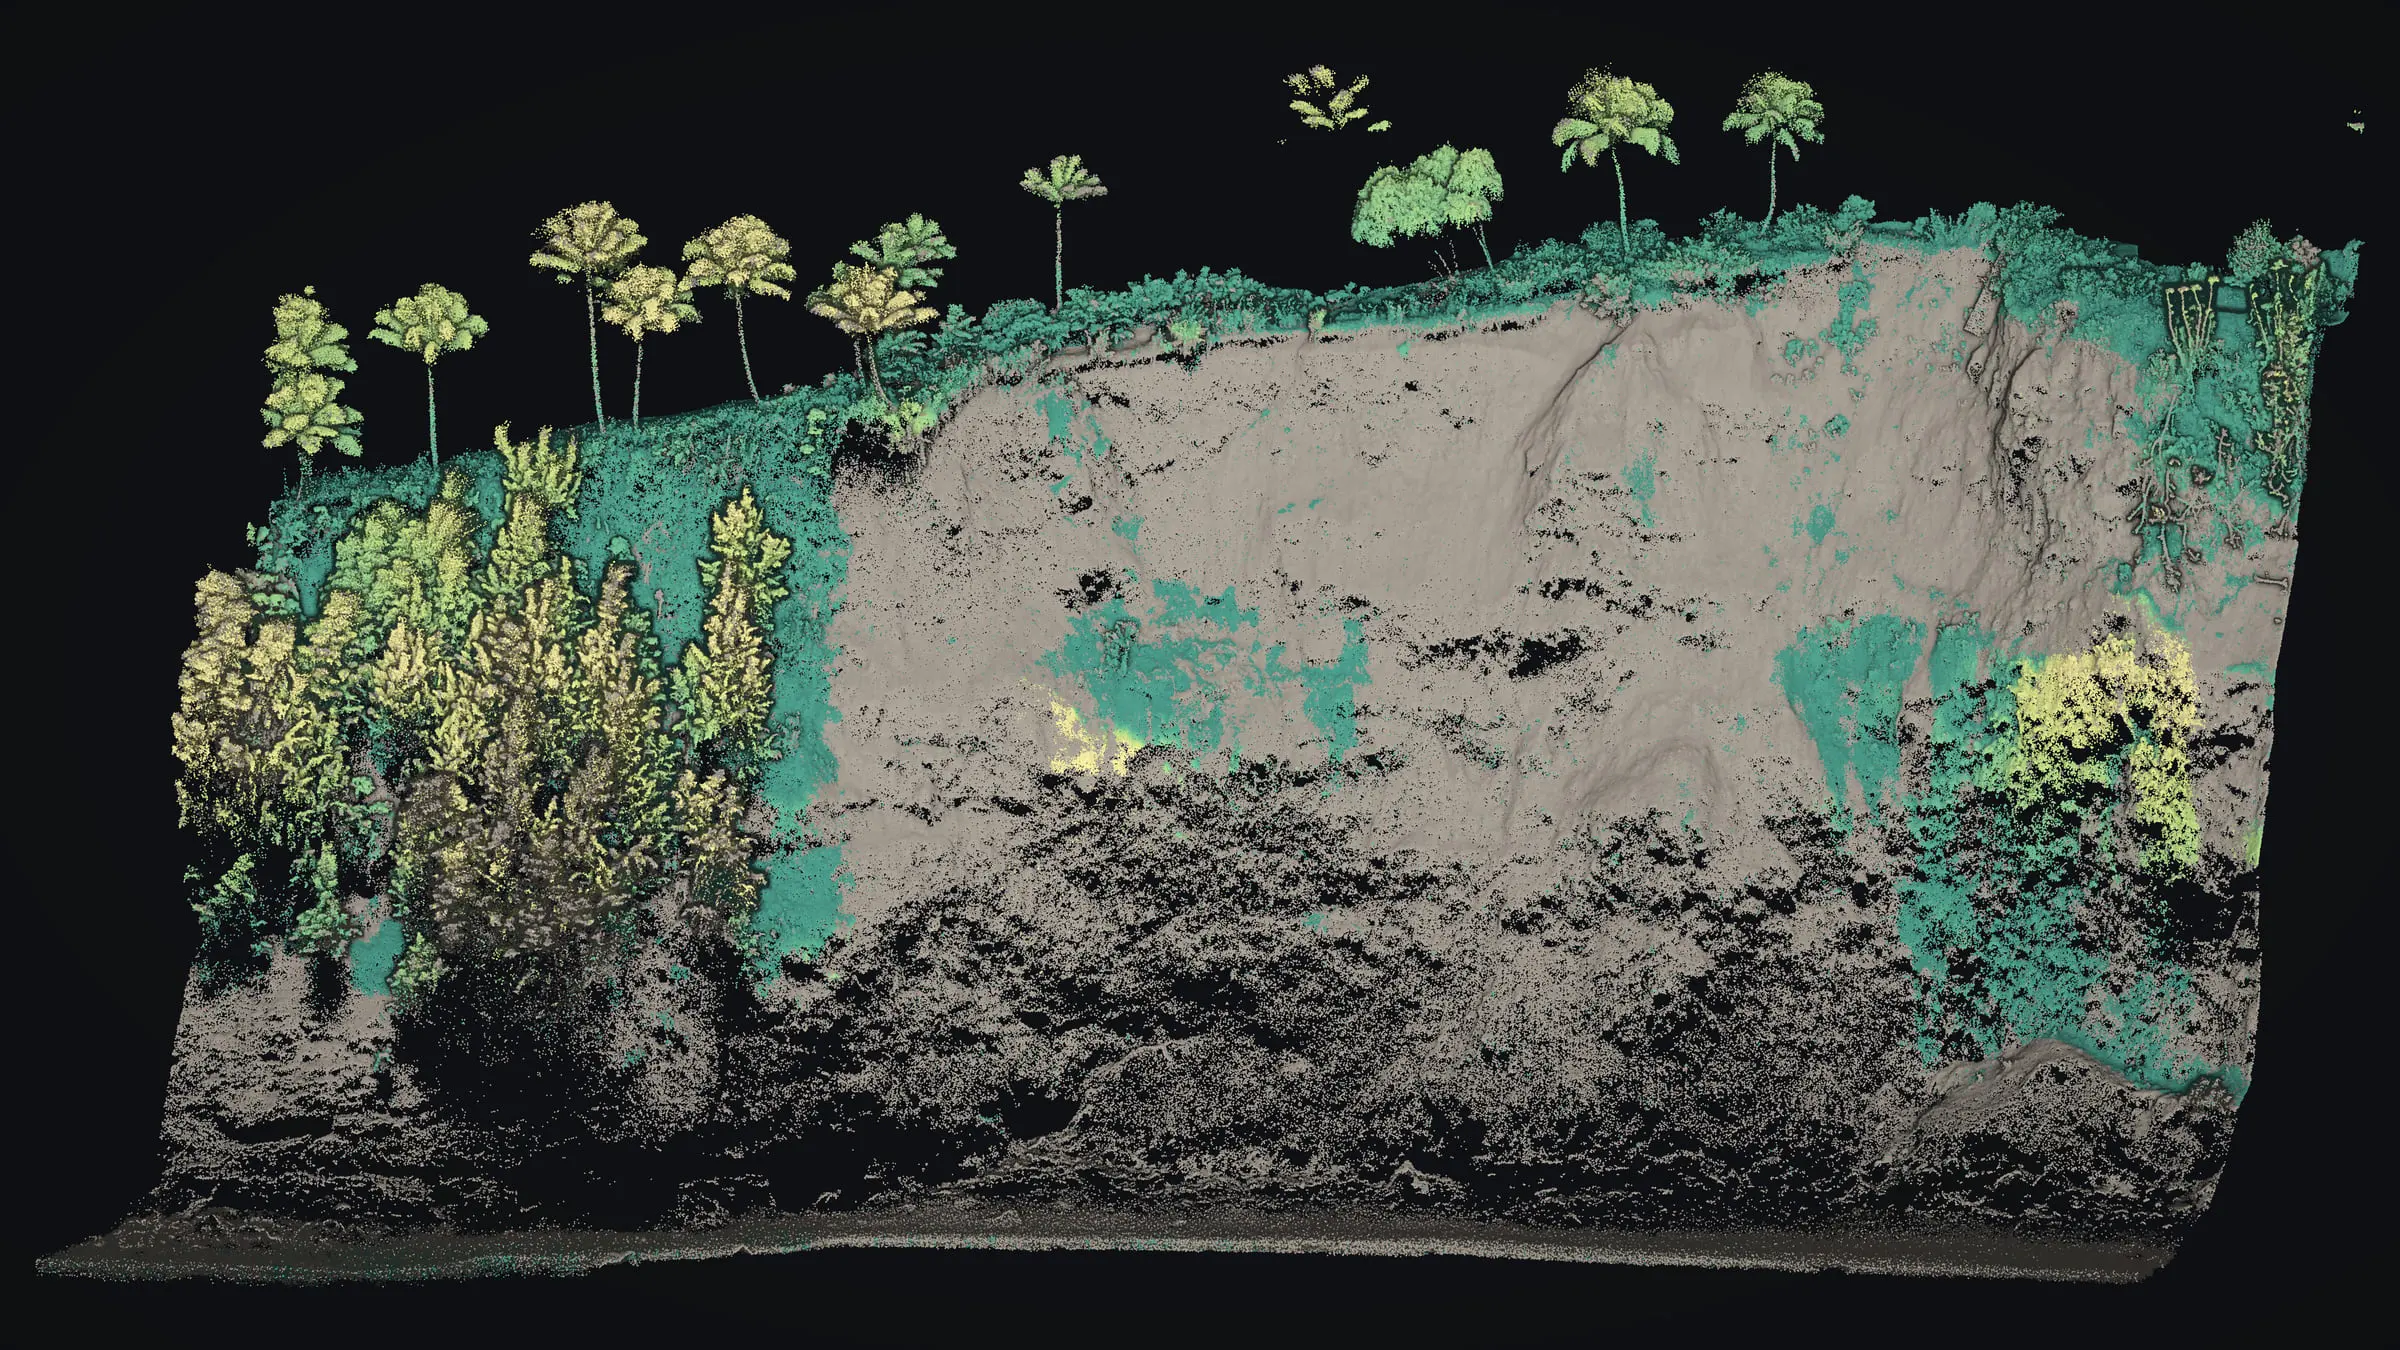
In November 2025 we flew a sea cliff on the Big Island with drone LiDAR for erosion monitoring. The flight recorded the face, 53 to 72 m (174 to 236 ft) from its foot to the top edge, and gives the cliff a baseline that later flights can be measured against.
The cliff, from the water to the top edge
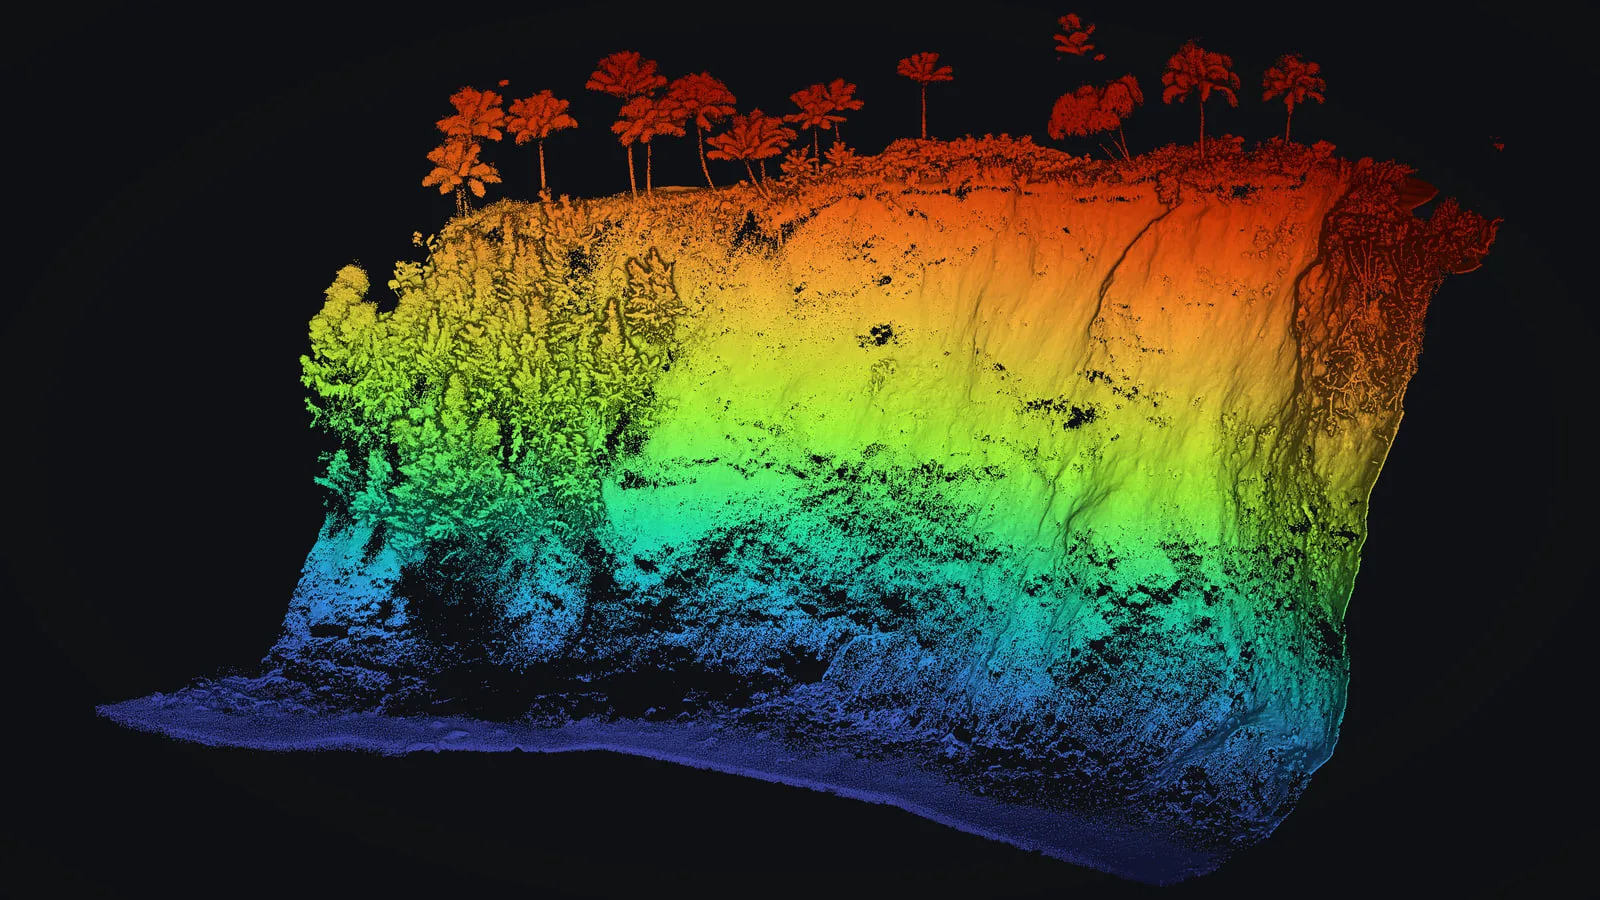
All from one drone LiDAR flight; open any frame full size.
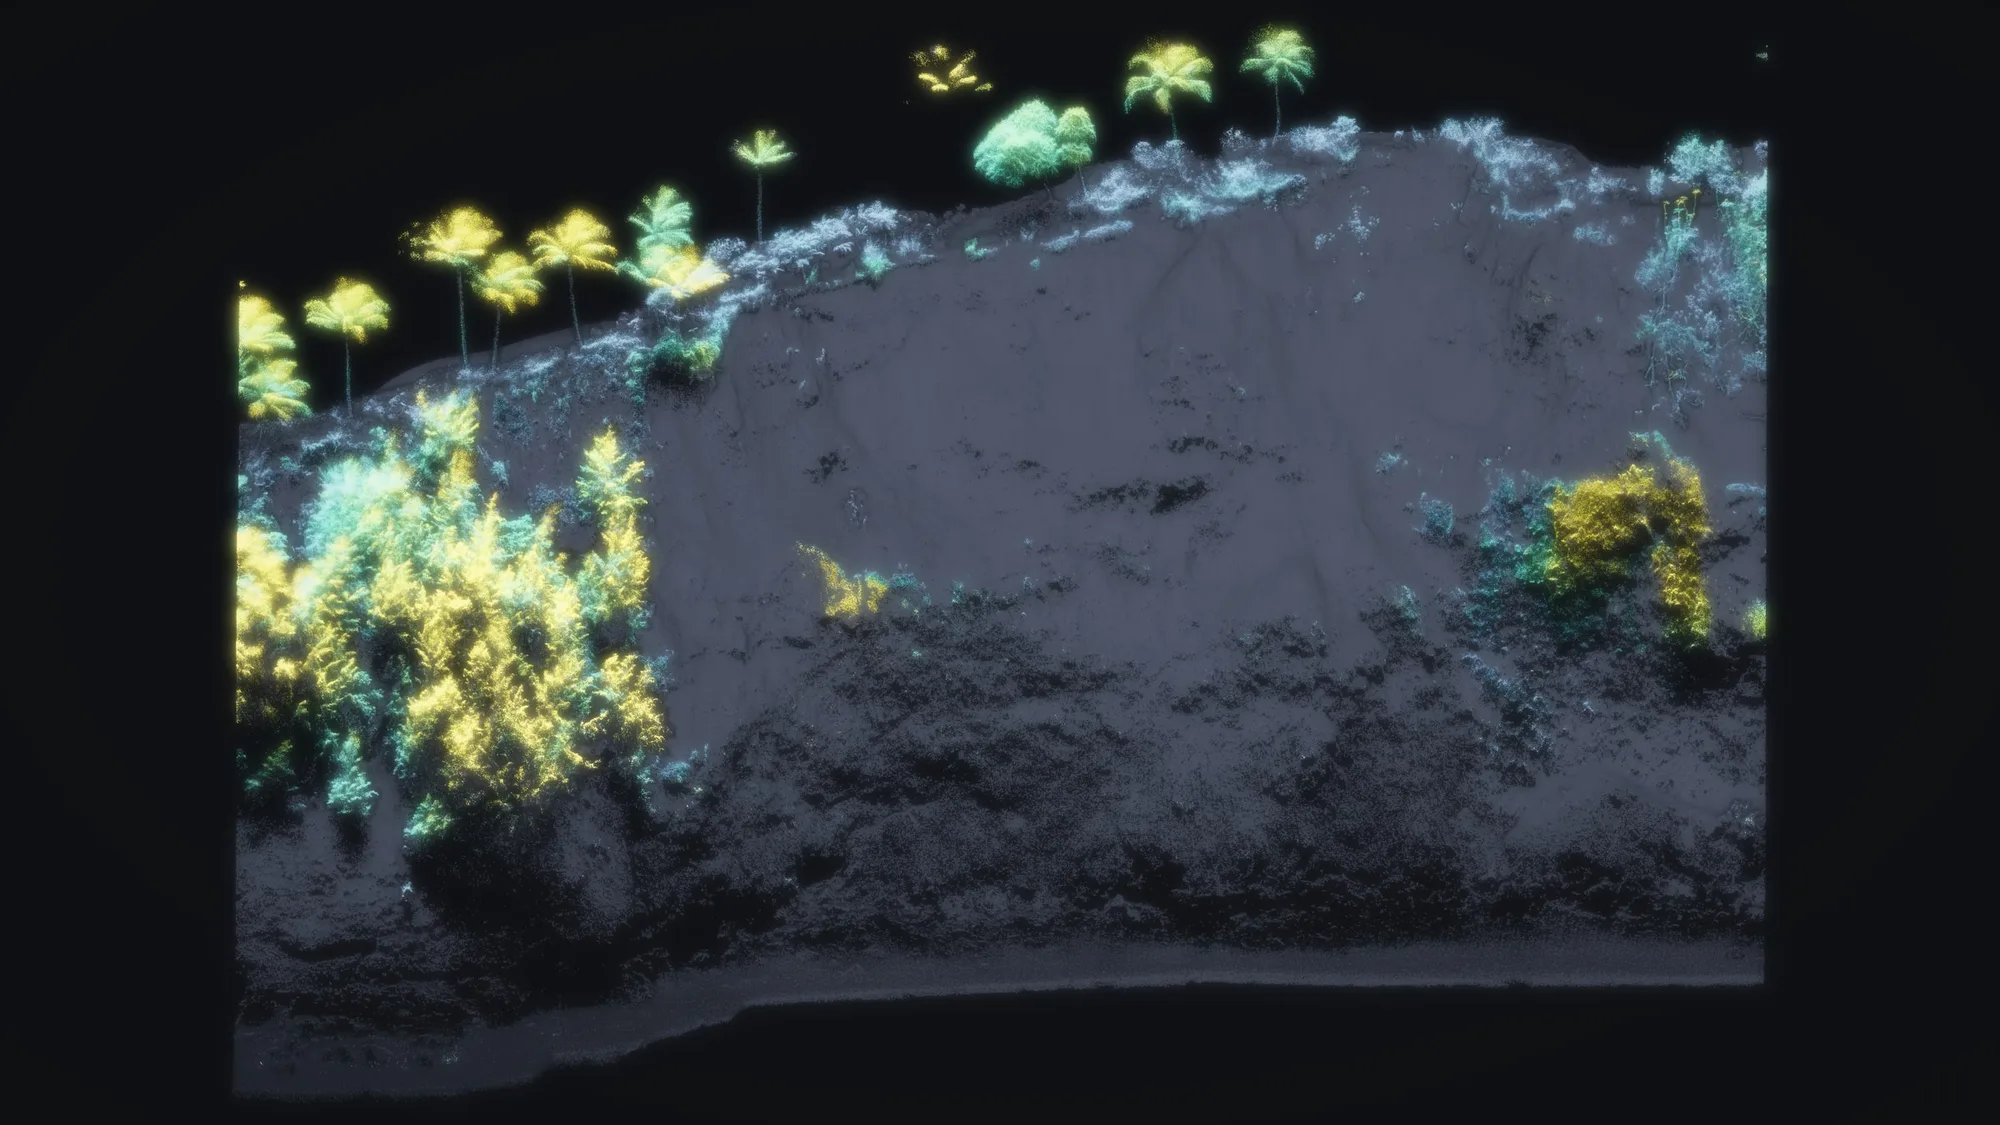

The problem
A sea cliff wears back a piece at a time: a slump in one place, a fresh scar in another, the top edge creeping inland. Photographs from the top or from the water catch some of it. Monitoring it takes a measured record of the whole face, made in a way that can be flown again, so each later flight has a fixed starting point to be compared with.
This face stands 53 to 72 m (174 to 236 ft) from its foot to the top edge along the stretch shown here, and most of it is steep: its median slope is 62 degrees, and about 90 percent of it is steeper than 45 degrees.
What we flew
A single drone LiDAR flight on November 23, 2025, about 24 minutes of recording, with a camera taking 536 photos alongside. It covered 16.6 acres, 13.4 of them land and the rest sea, and returned 77,020,870 points, about 1,400 to each square meter over the land.
Why LiDAR suits a cliff
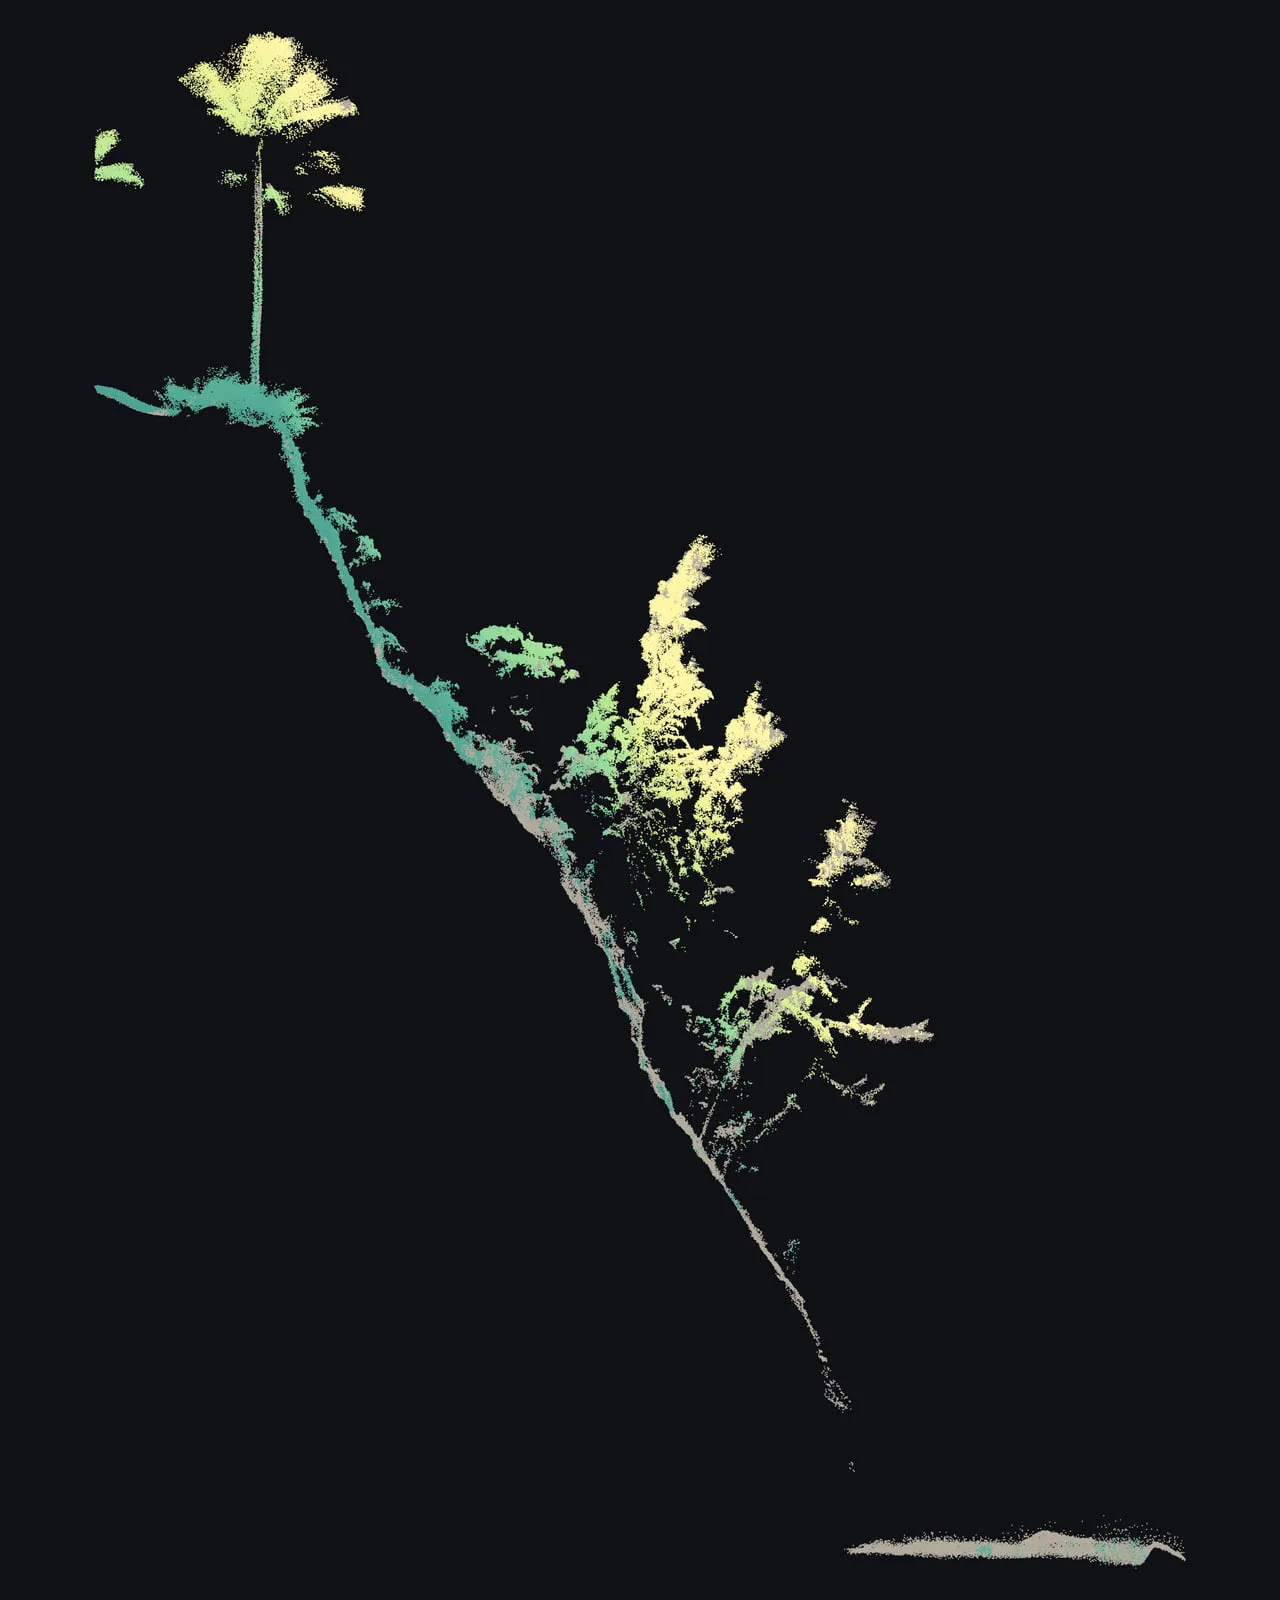
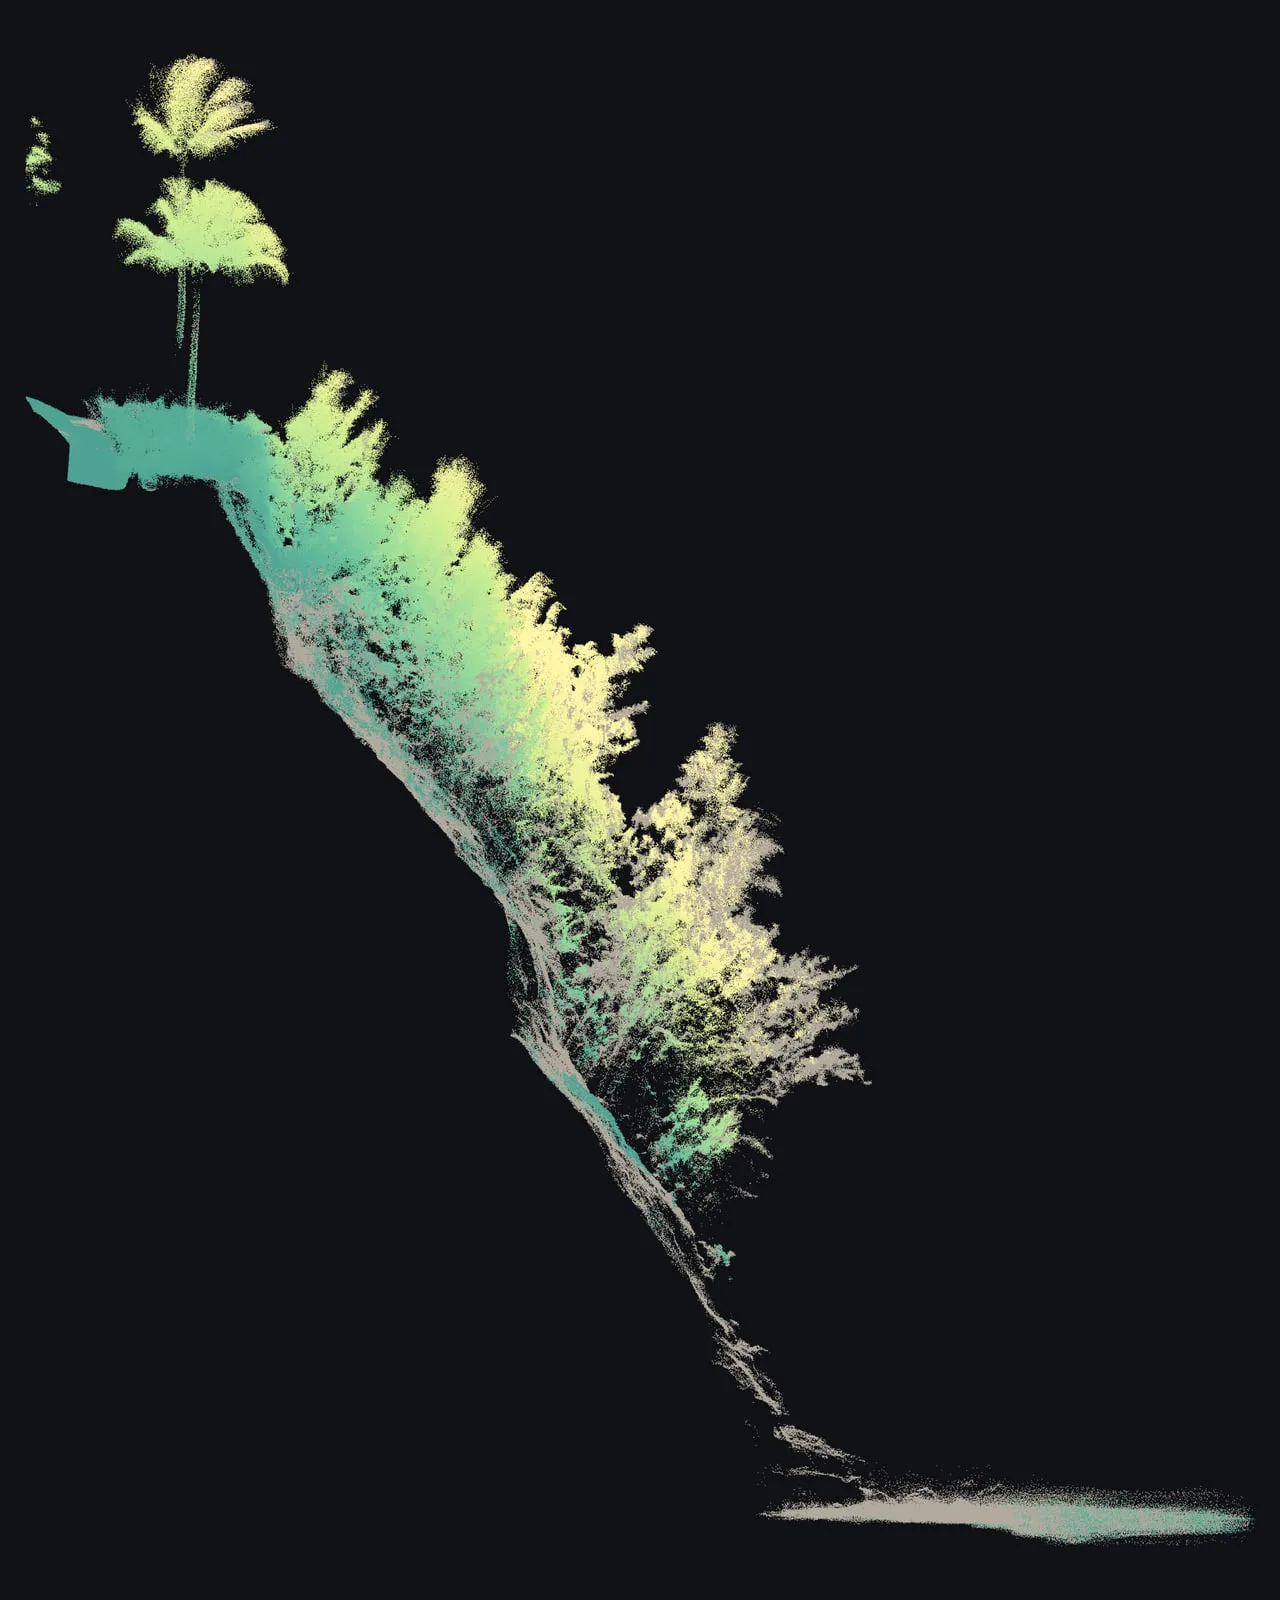
Looking straight down, a camera sees the top edge and the foot of a cliff and very little of what lies between. The laser pulses from a drone strike the face itself, so the point cloud holds the rock, the soil and the plants clinging to it. Cut a thin slice square to the cliff and the whole profile appears, from the palms on the top edge down to the water.
What we delivered
- A classified, colorized point cloud of 77,020,870 points
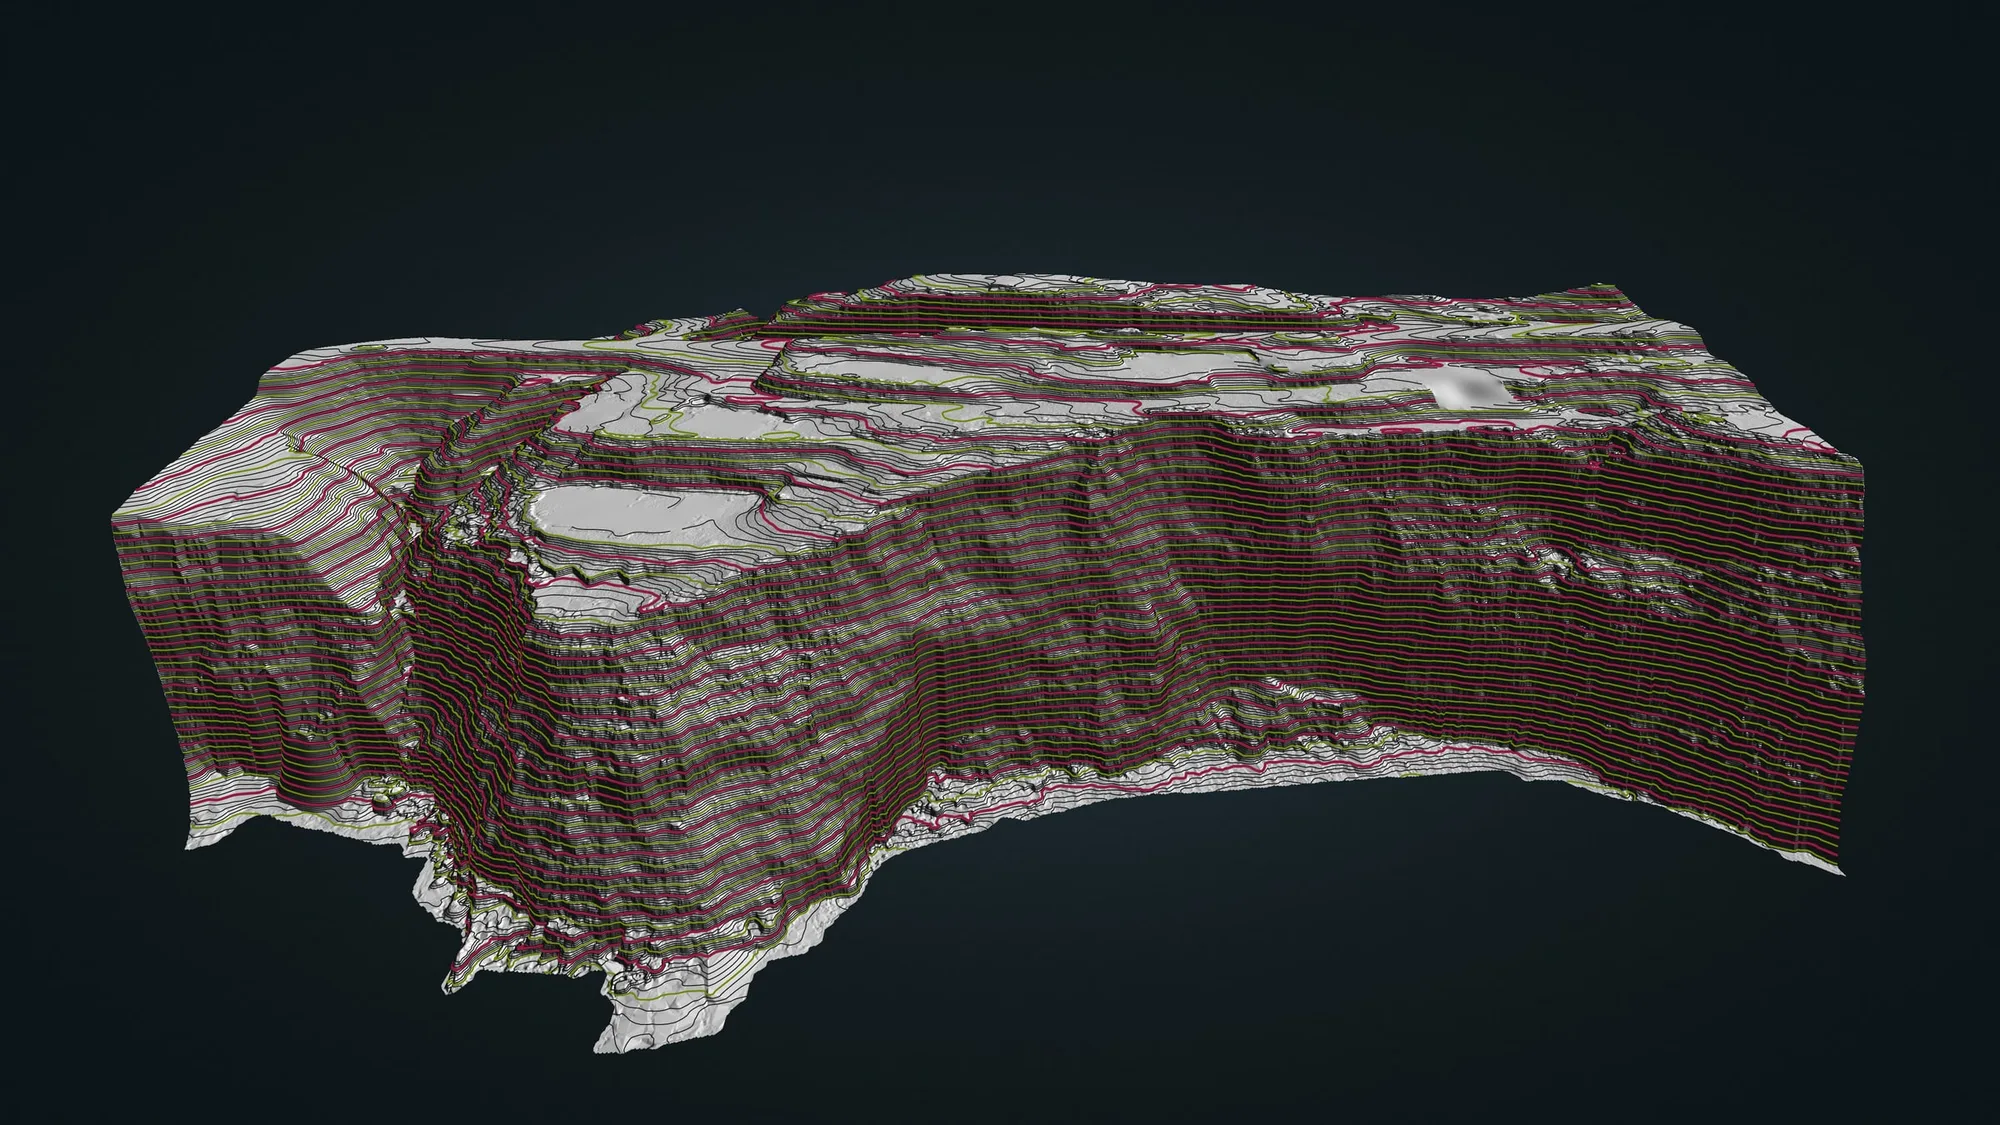
- A bare earth model with 0.25 m cells, in feet and in meters
- Surface and canopy height models from the same cloud
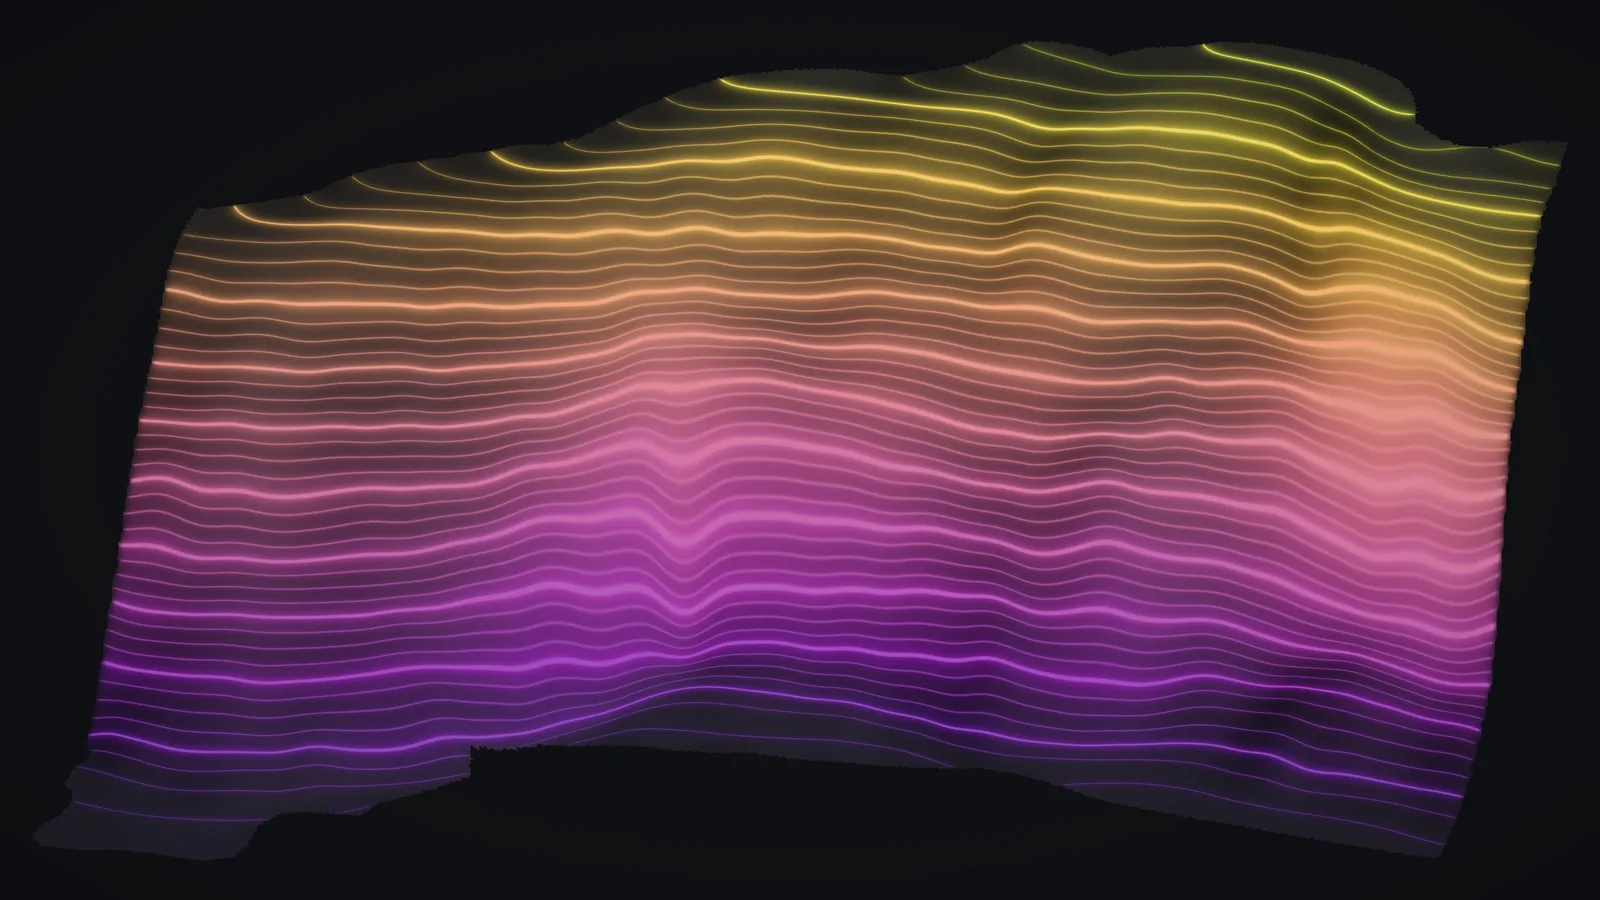
- Contours every 1 ft
- An orthophoto and web map tile packages
A baseline, not yet a change map
This flight is the first measurement of the cliff, and no change has been measured from it yet. Its worth grows with the next flight. Flown again the same way, a second point cloud can be lined up with this one on ground that should not have moved and compared along the face, to find where material has fallen away and how far the top edge has moved.
If you own land above a sea cliff, or look after coastal land for an agency or a conservation group, the record starts the same way: one flight now, a baseline on file, and a like for like comparison once the next flight is flown.
The numbers
- points in the classified cloud
- 77,020,870
- acres flown, 13.4 of them land
- 16.6
- points per square meter over land
- about 1,400
- meters from the foot of the face to the top edge
- 53 to 72
- the same in feet
- 174 to 236
- median slope of the face
- 62°
Cliff heights are measured inside the bare earth model, from the foot of the face to its top edge along the stretch shown in these pictures. They are heights relative to each other, not elevations.
Related work and services
A coast or a slope that needs a baseline?
Send the island and roughly where, how long a stretch, and who may see the data. A private location stays off anything we publish, as it does on this page.