
Case study · building site topography
A North Kona hillside, mapped before anything is built
A landowner in North Kona, planning to build on a terraced hillside, wanted to know what the ground really does. One drone LiDAR flight answered it: 140 ft of fall, every terrace and bank, every tree, in files an architect and a designer can open.
The hillside, in its own data
Every picture here is a product of one flight. Tap any of them to see it large.
-
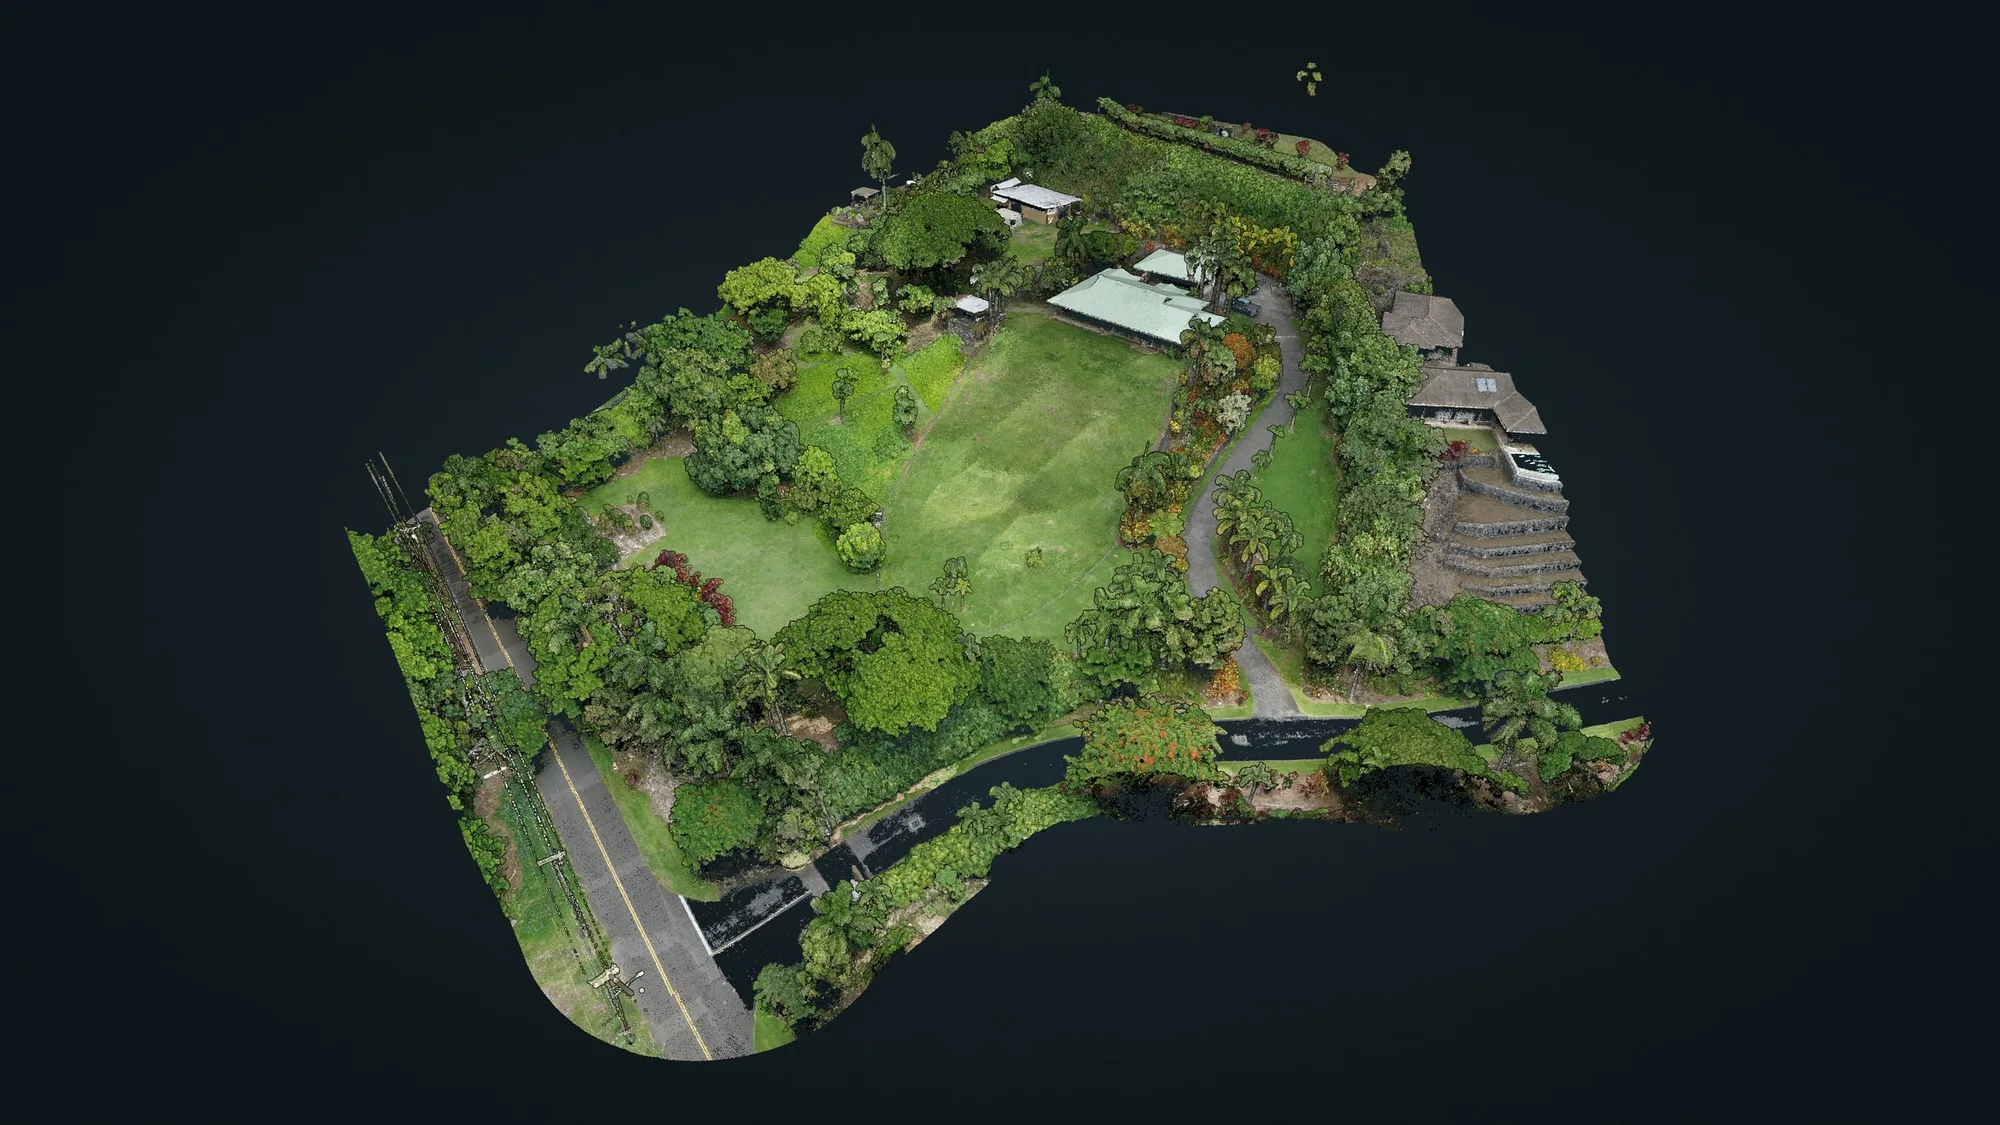
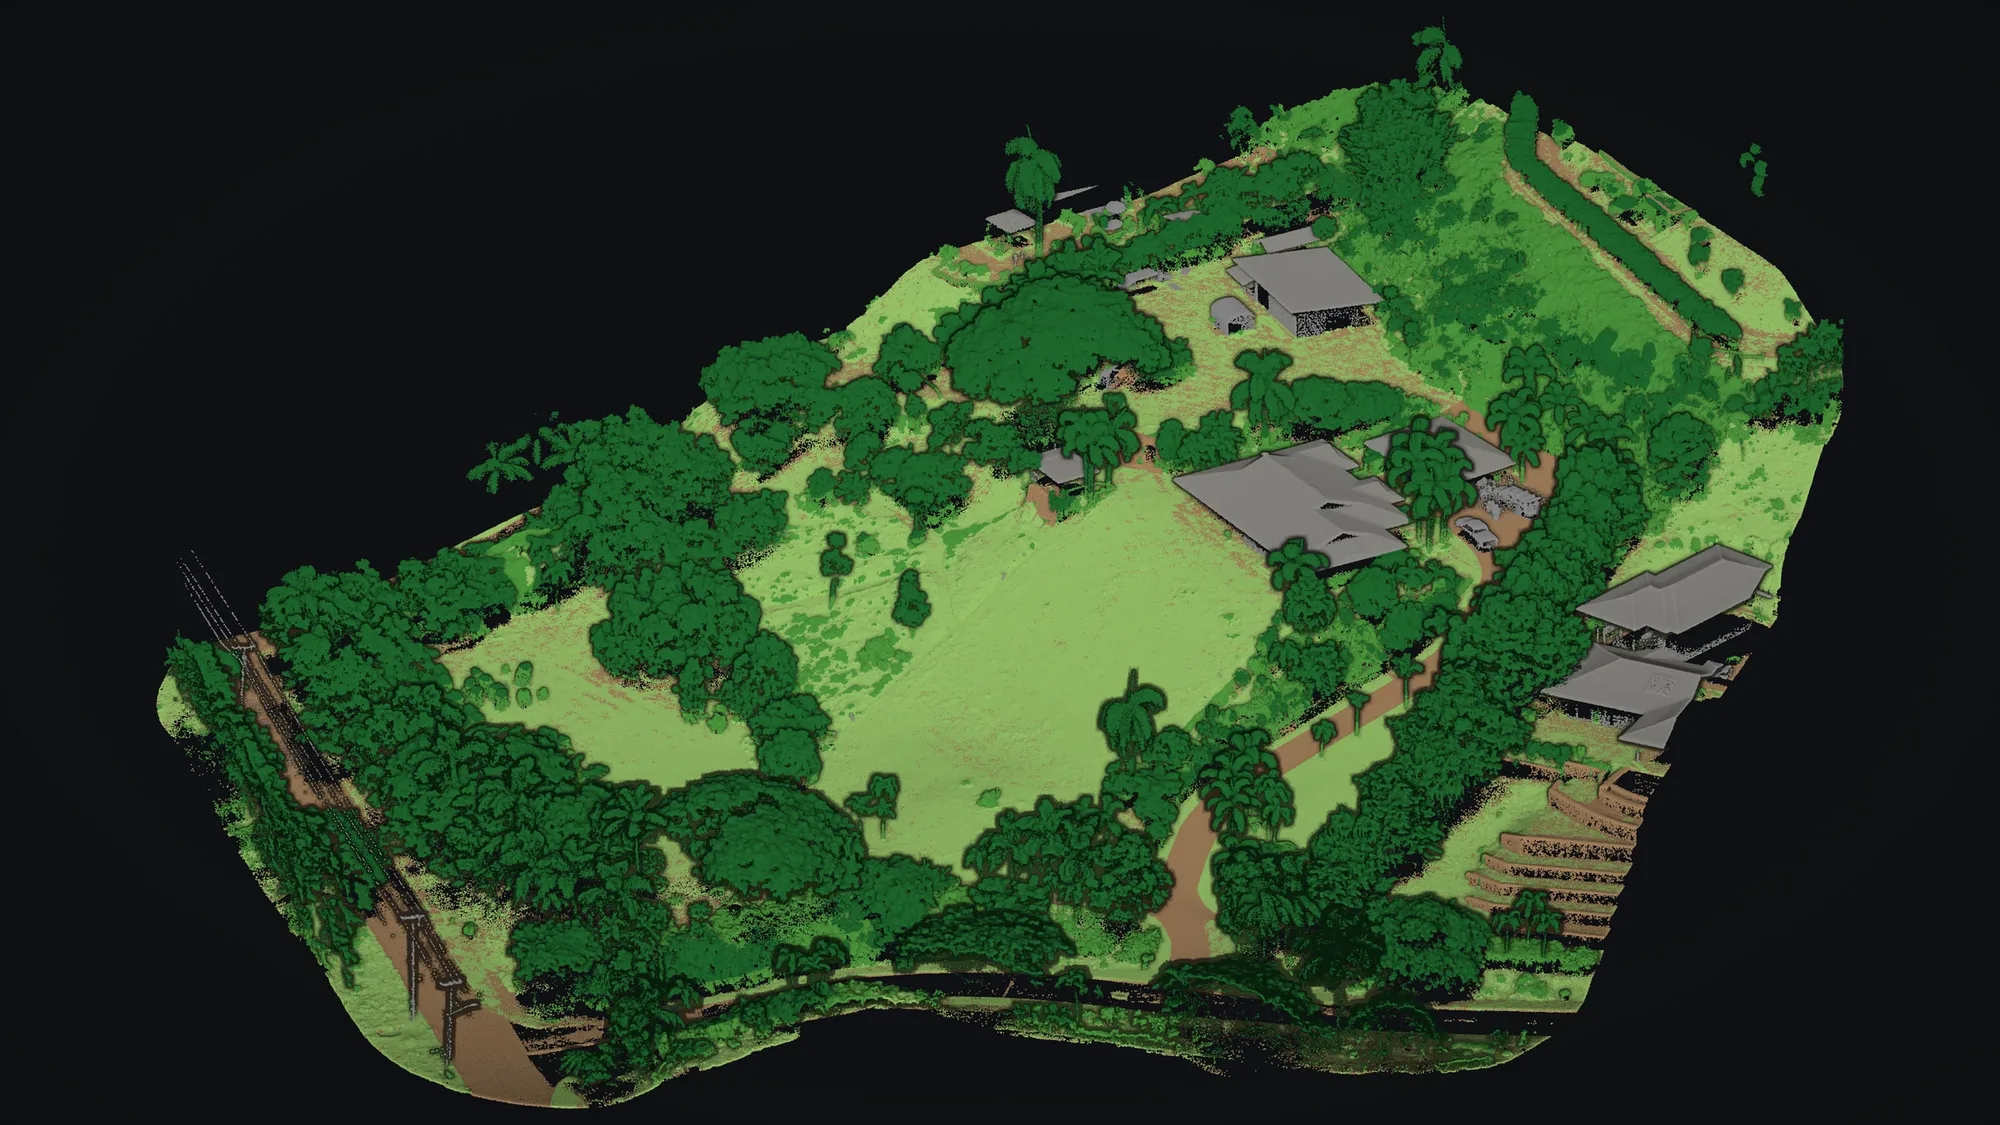
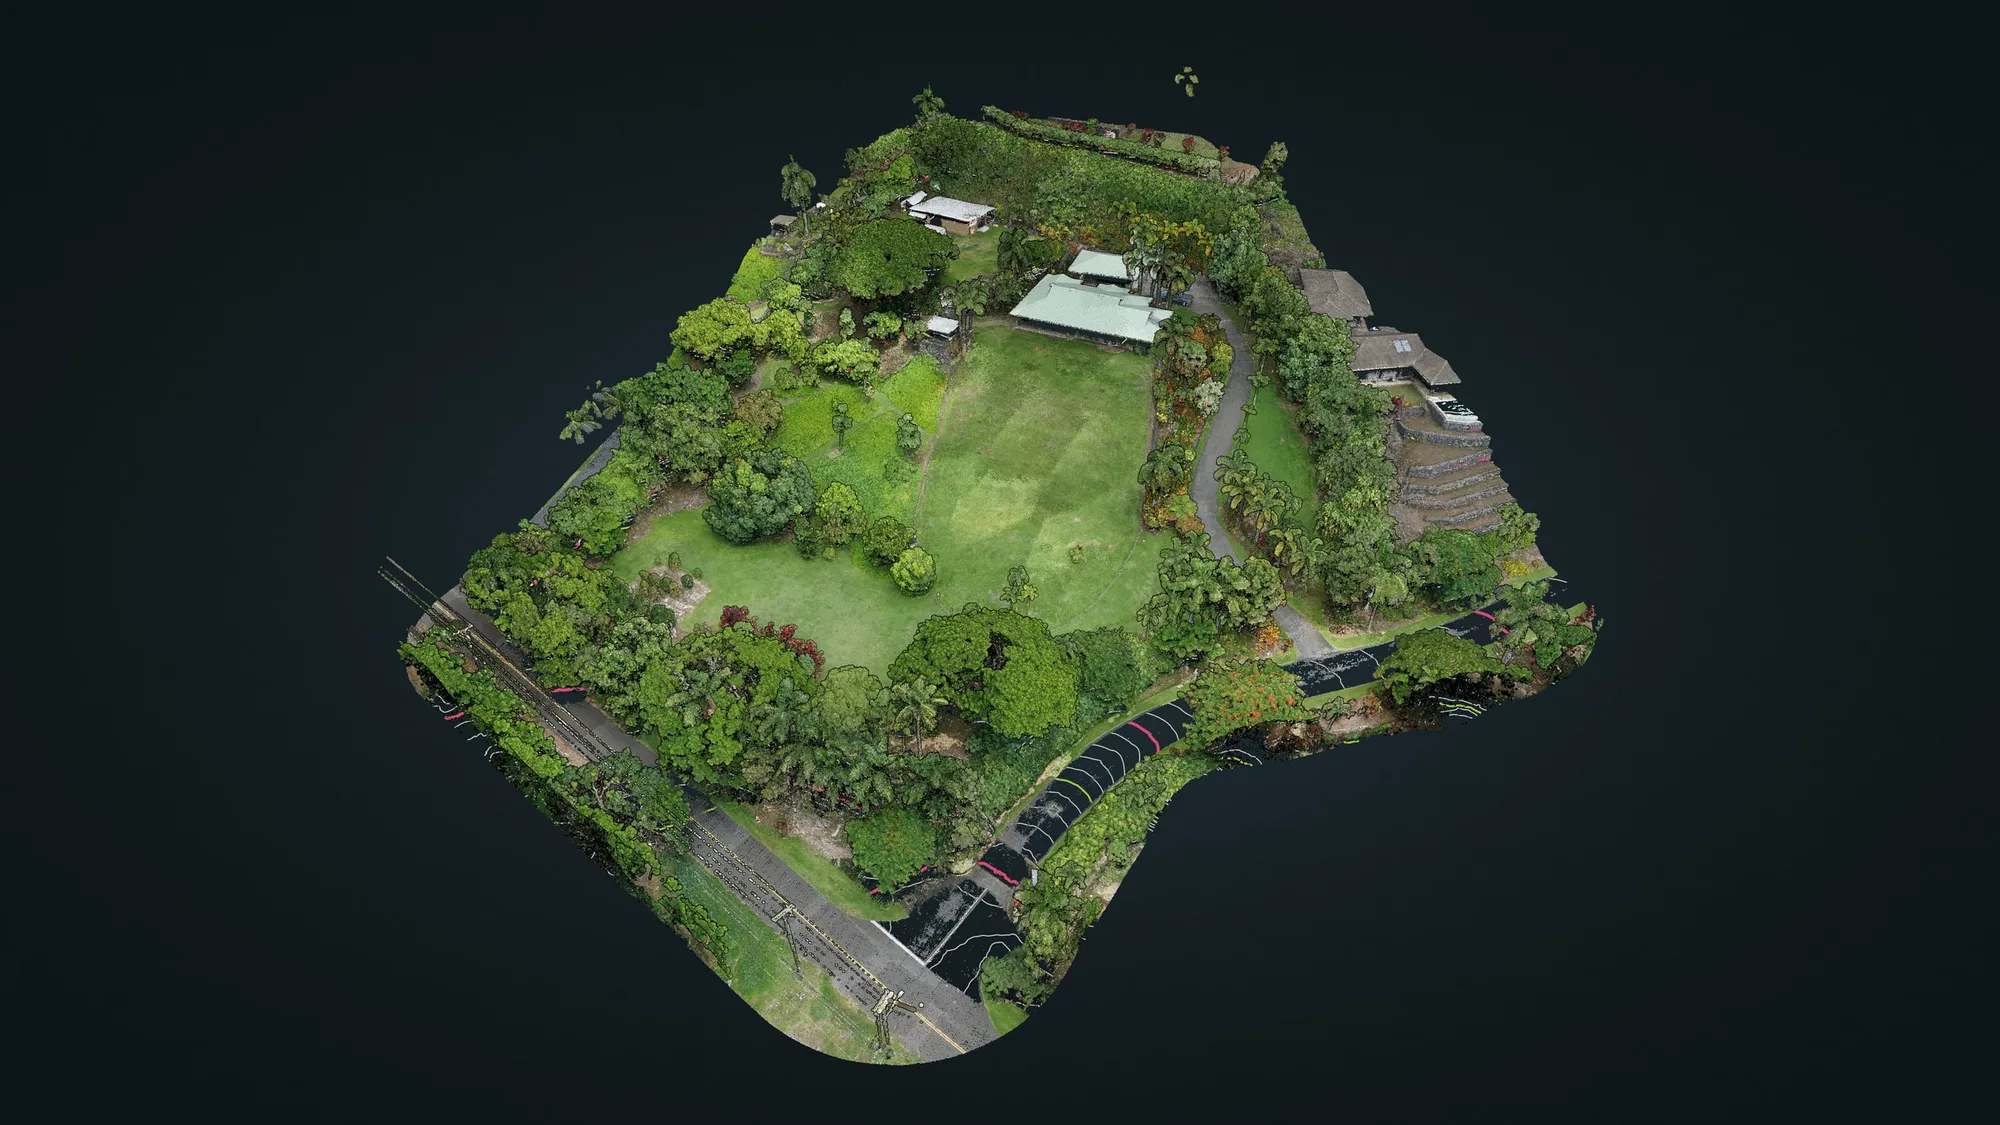
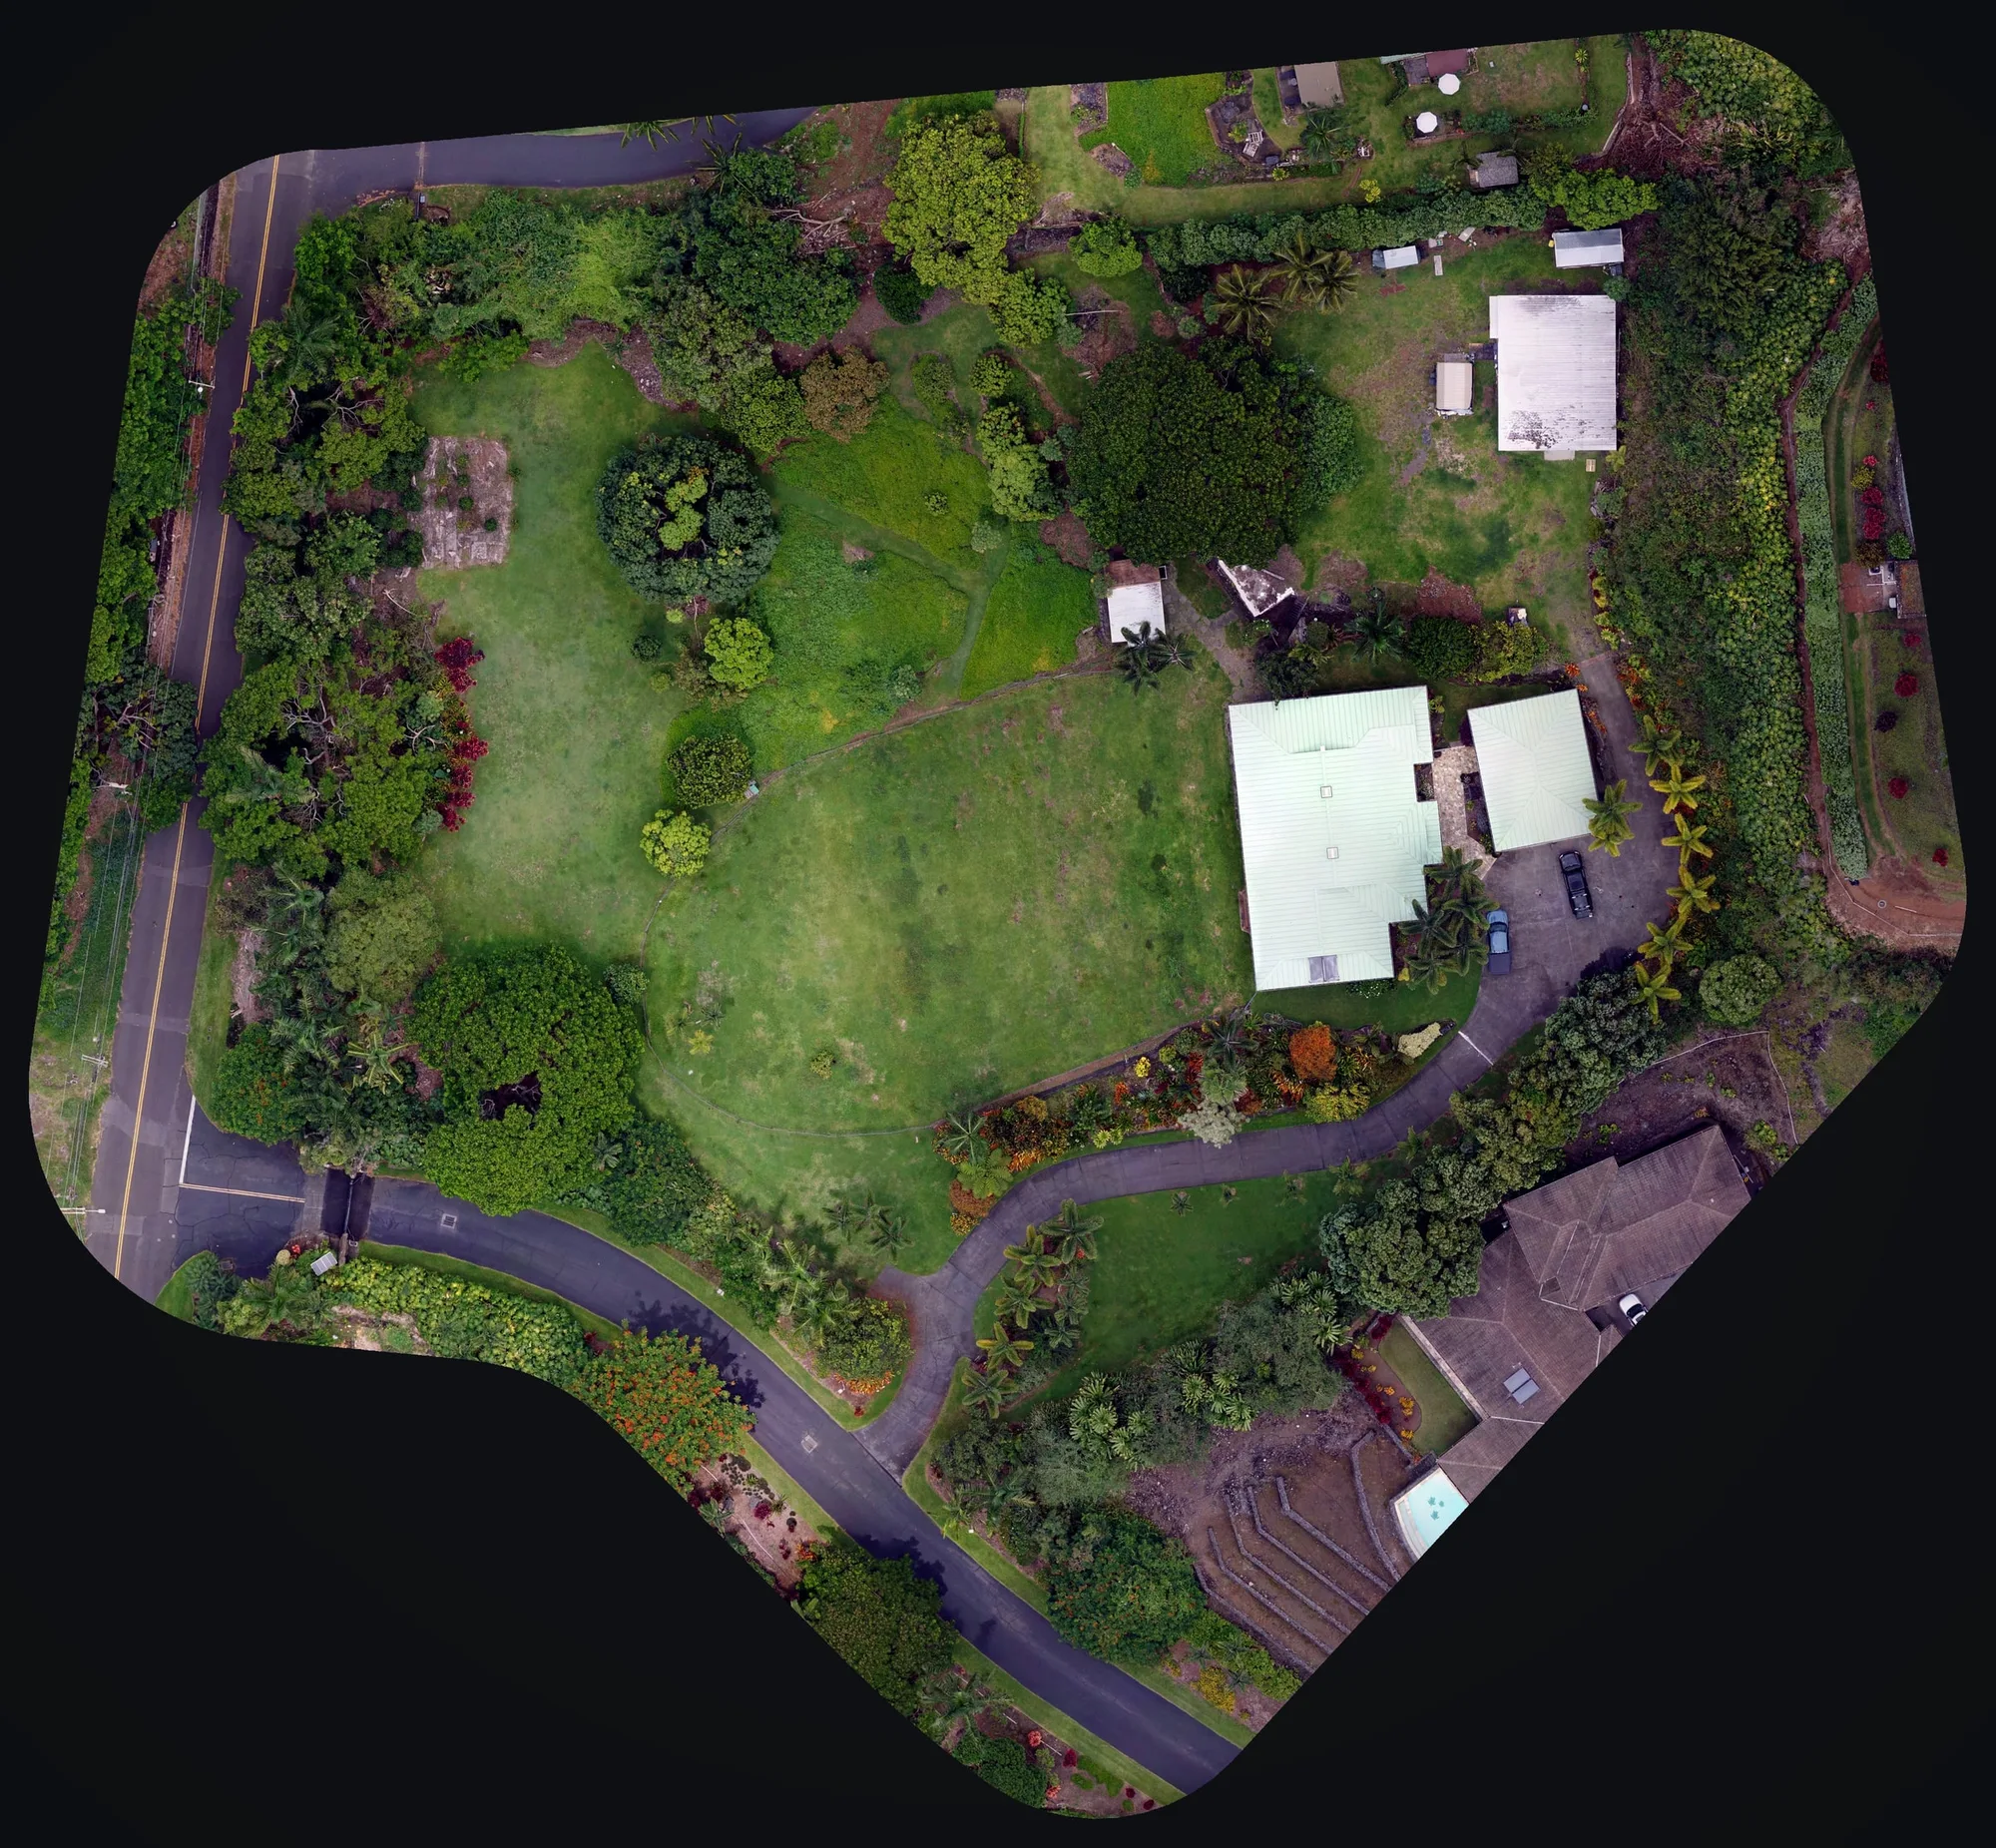
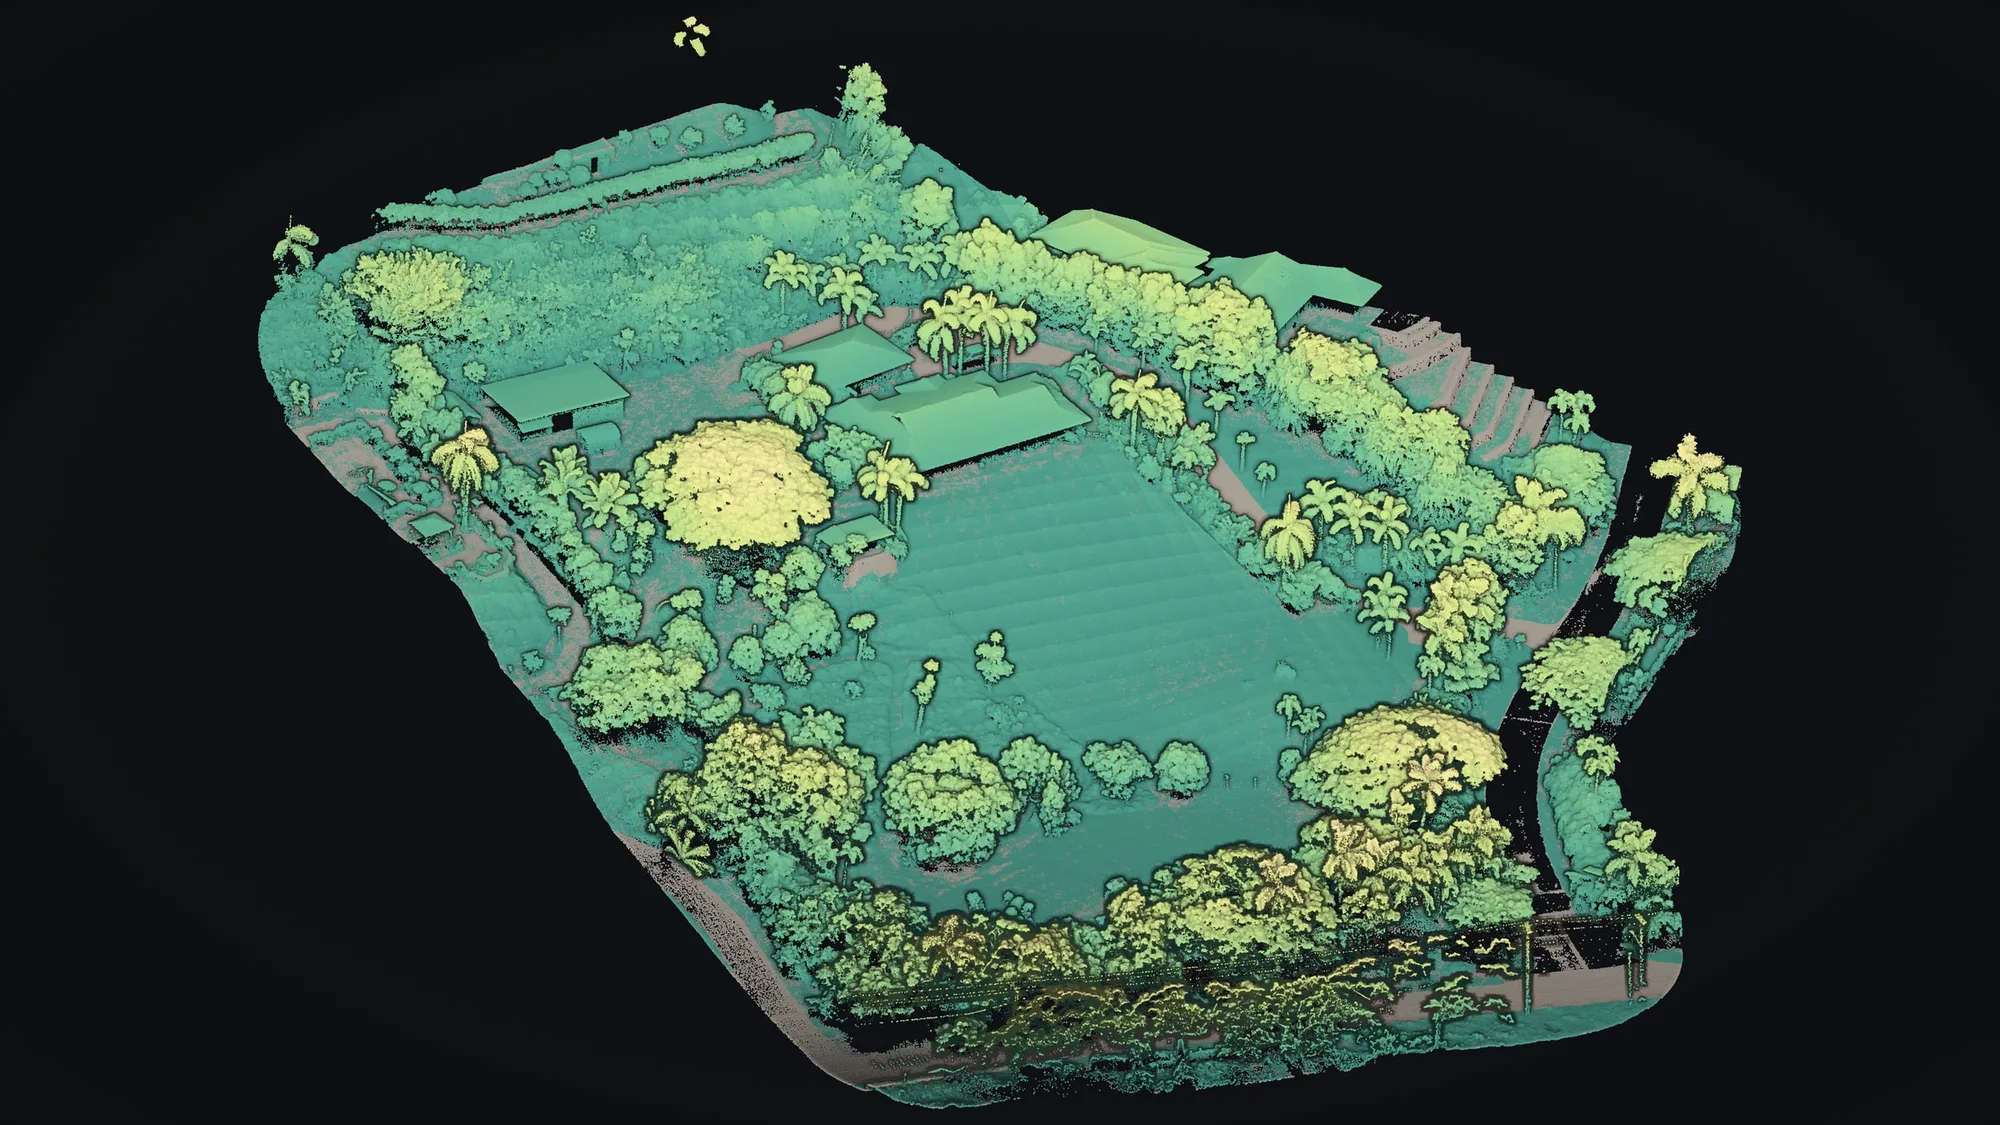
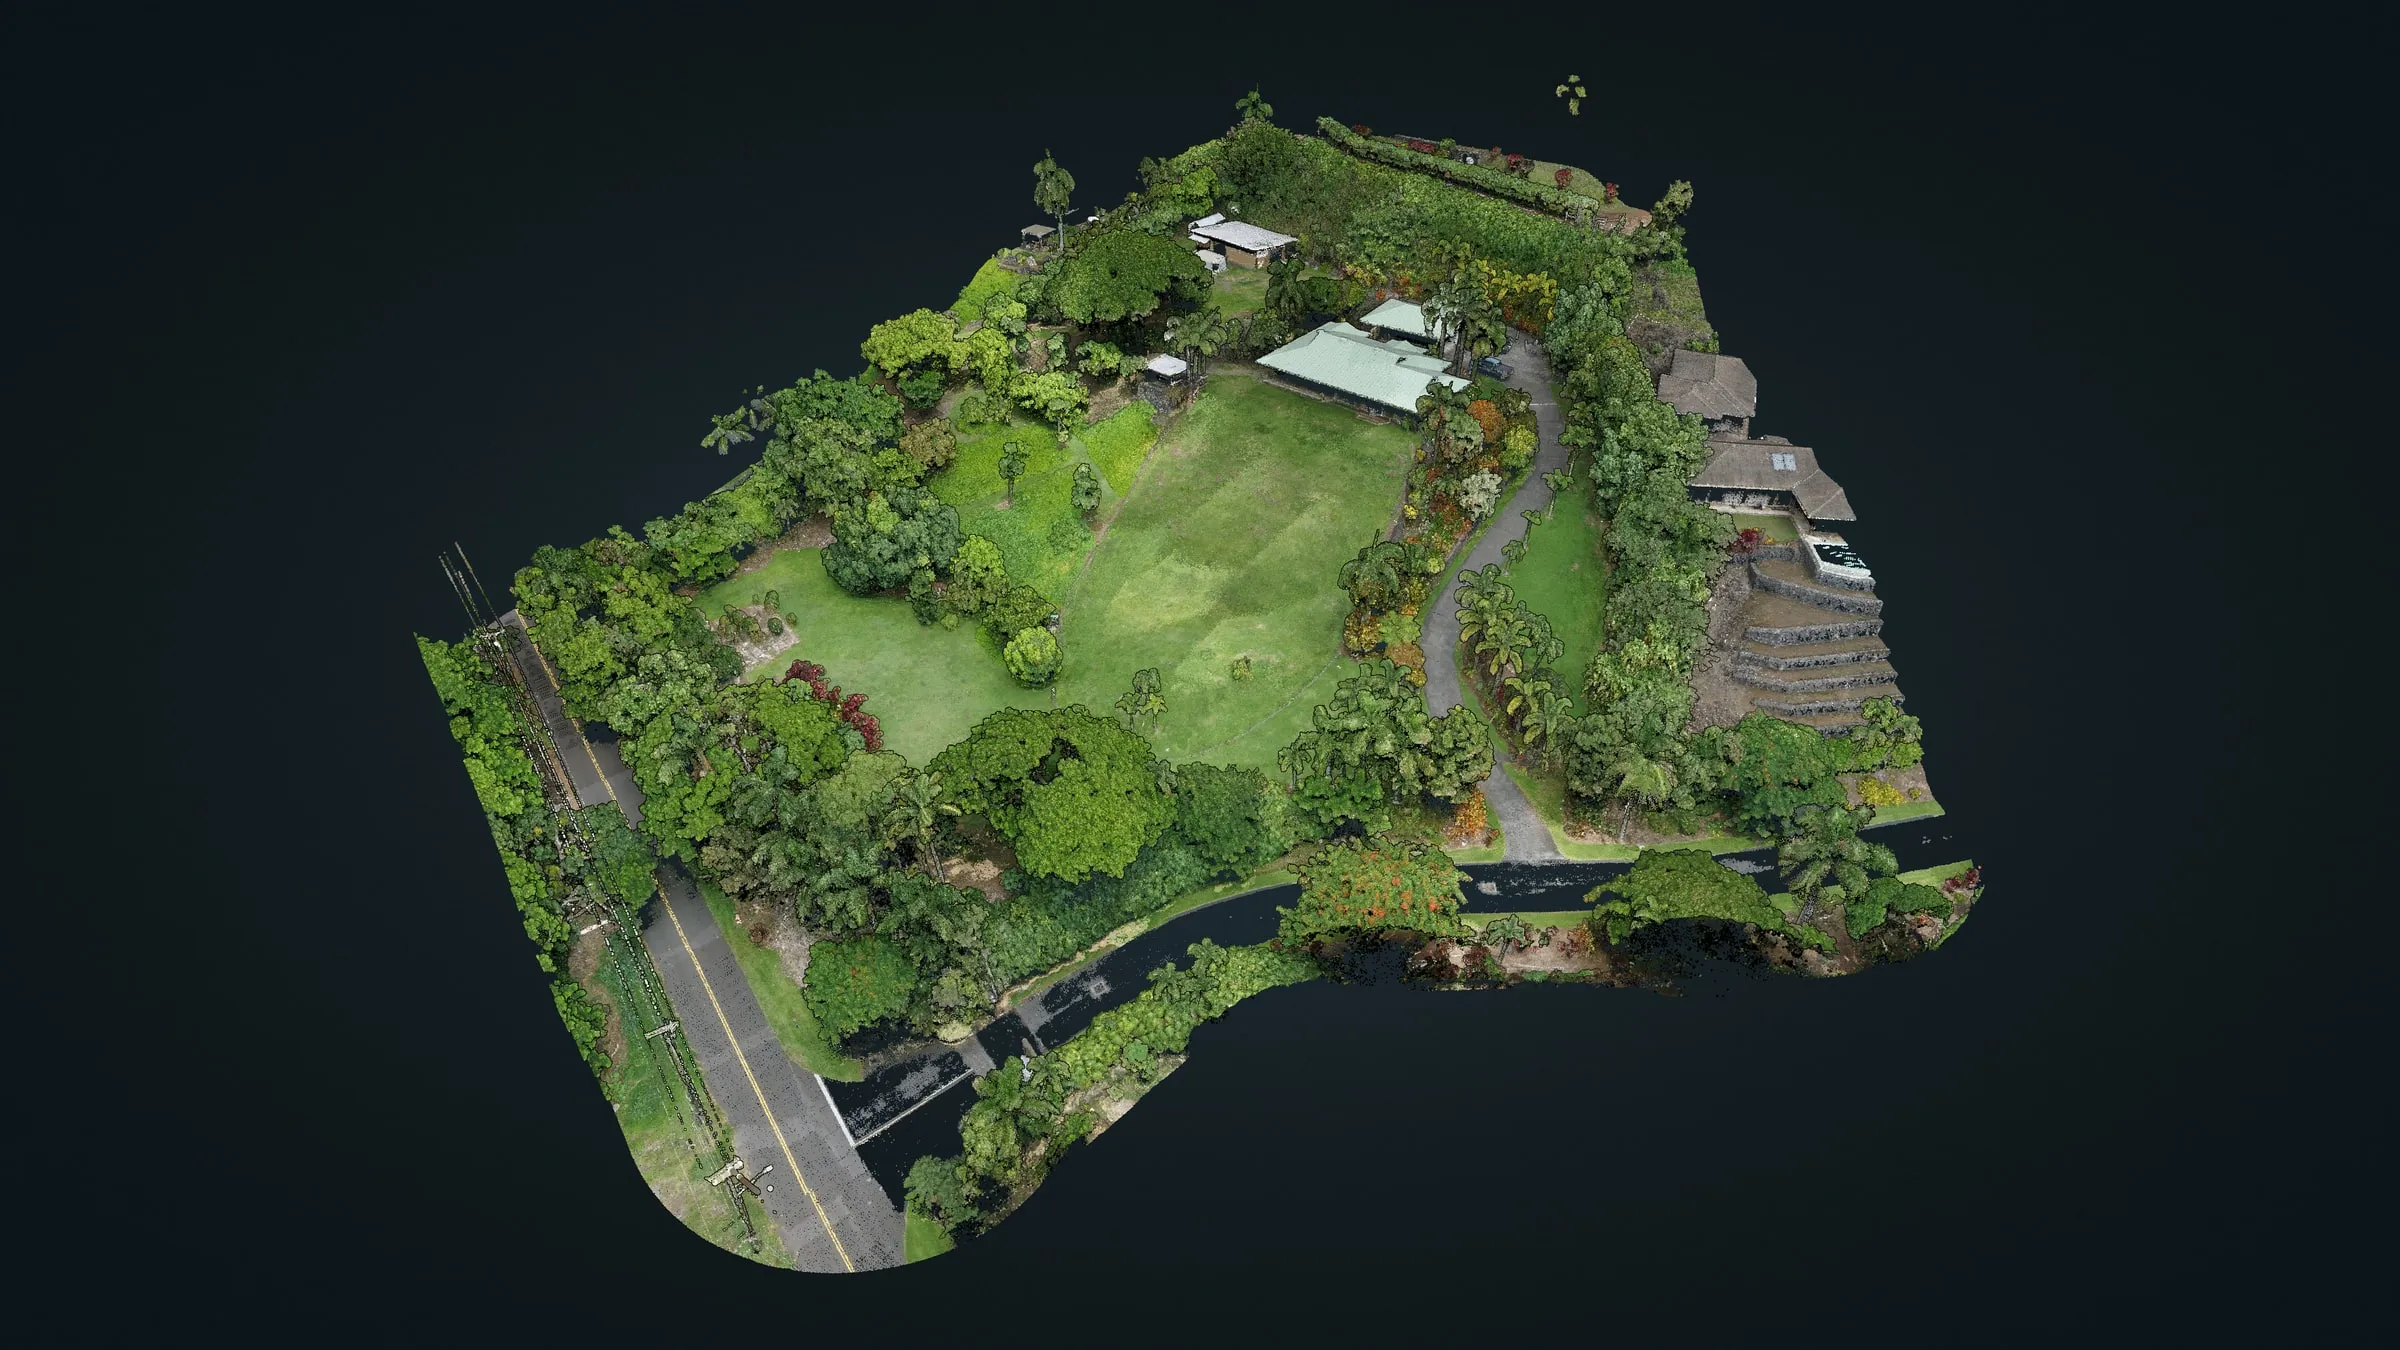 The point cloud in true color, as the landowner opens it in our online viewer
 -
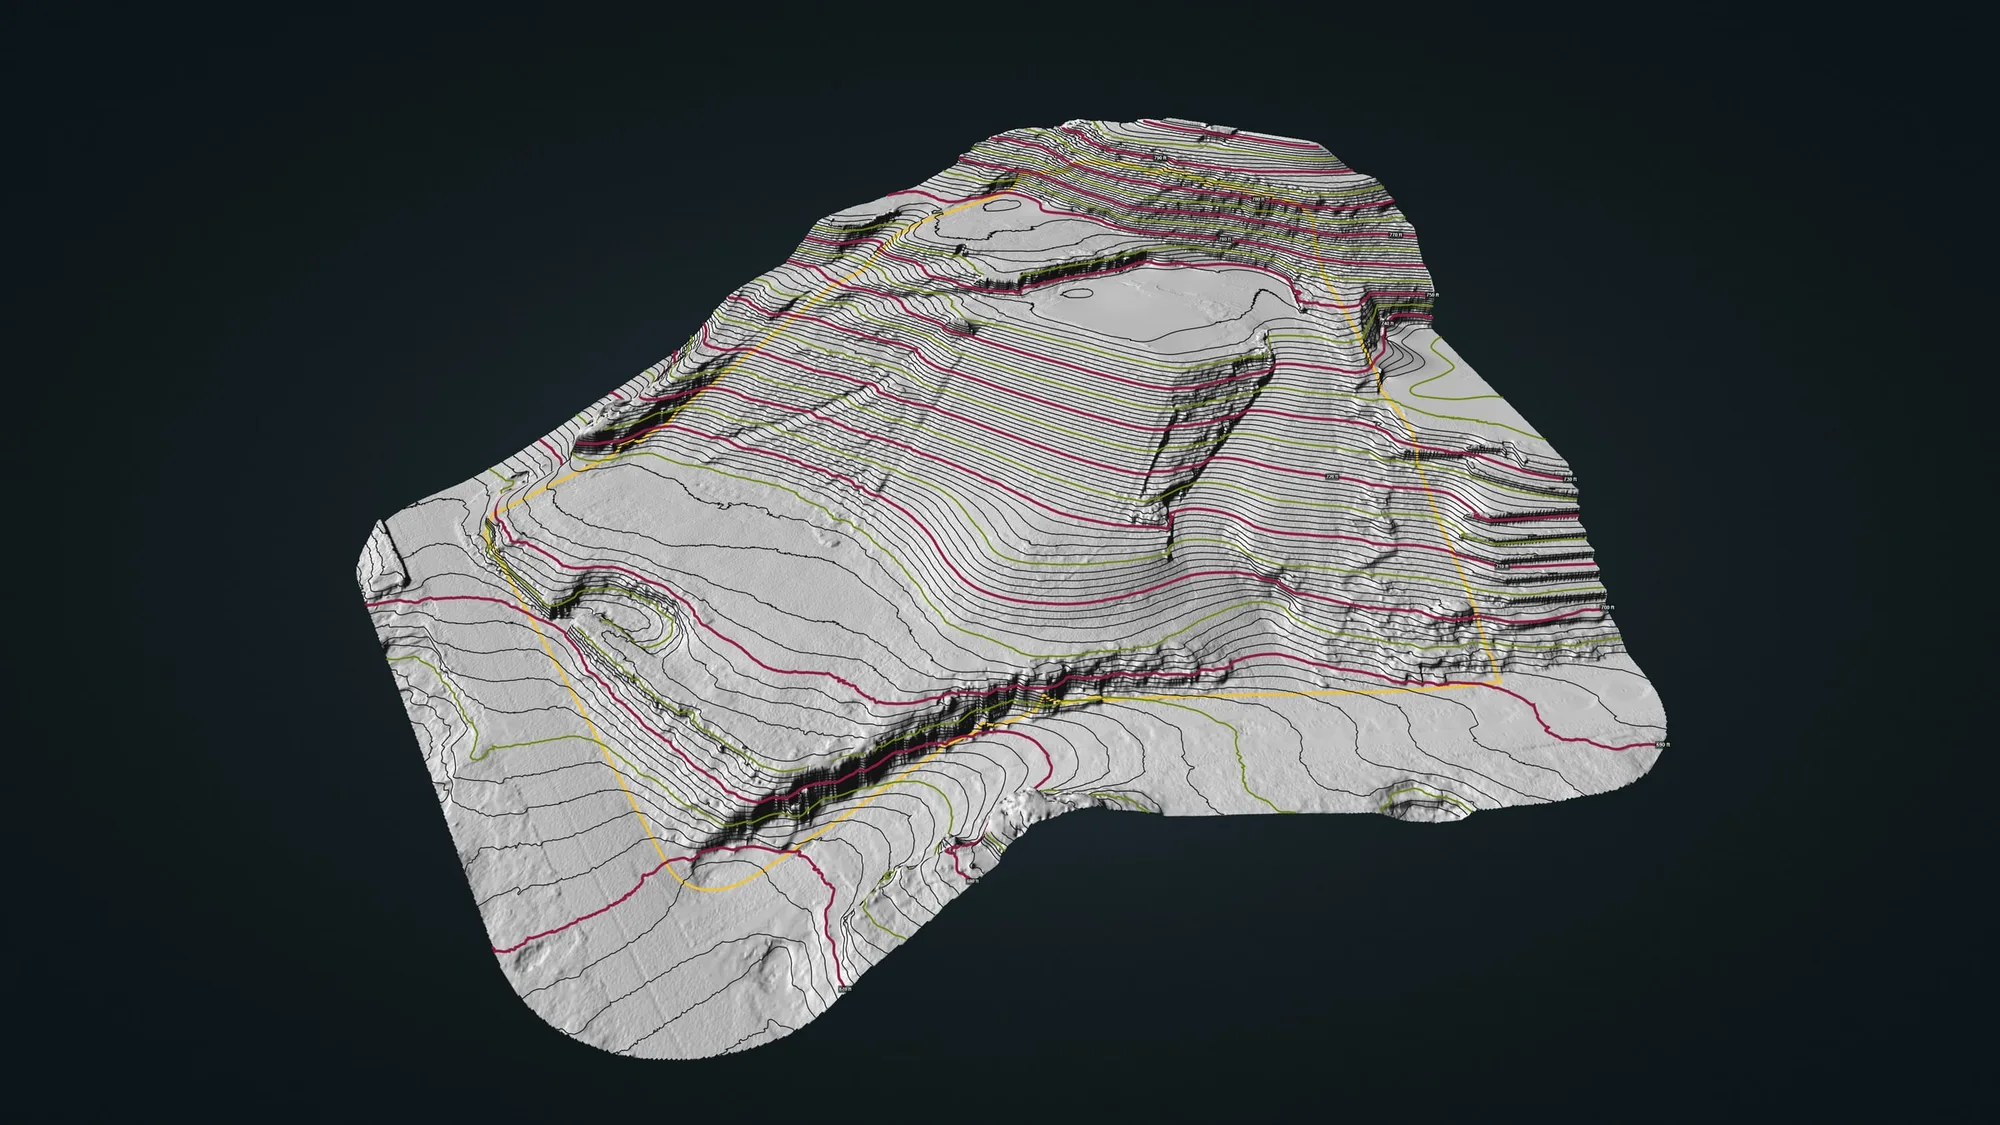
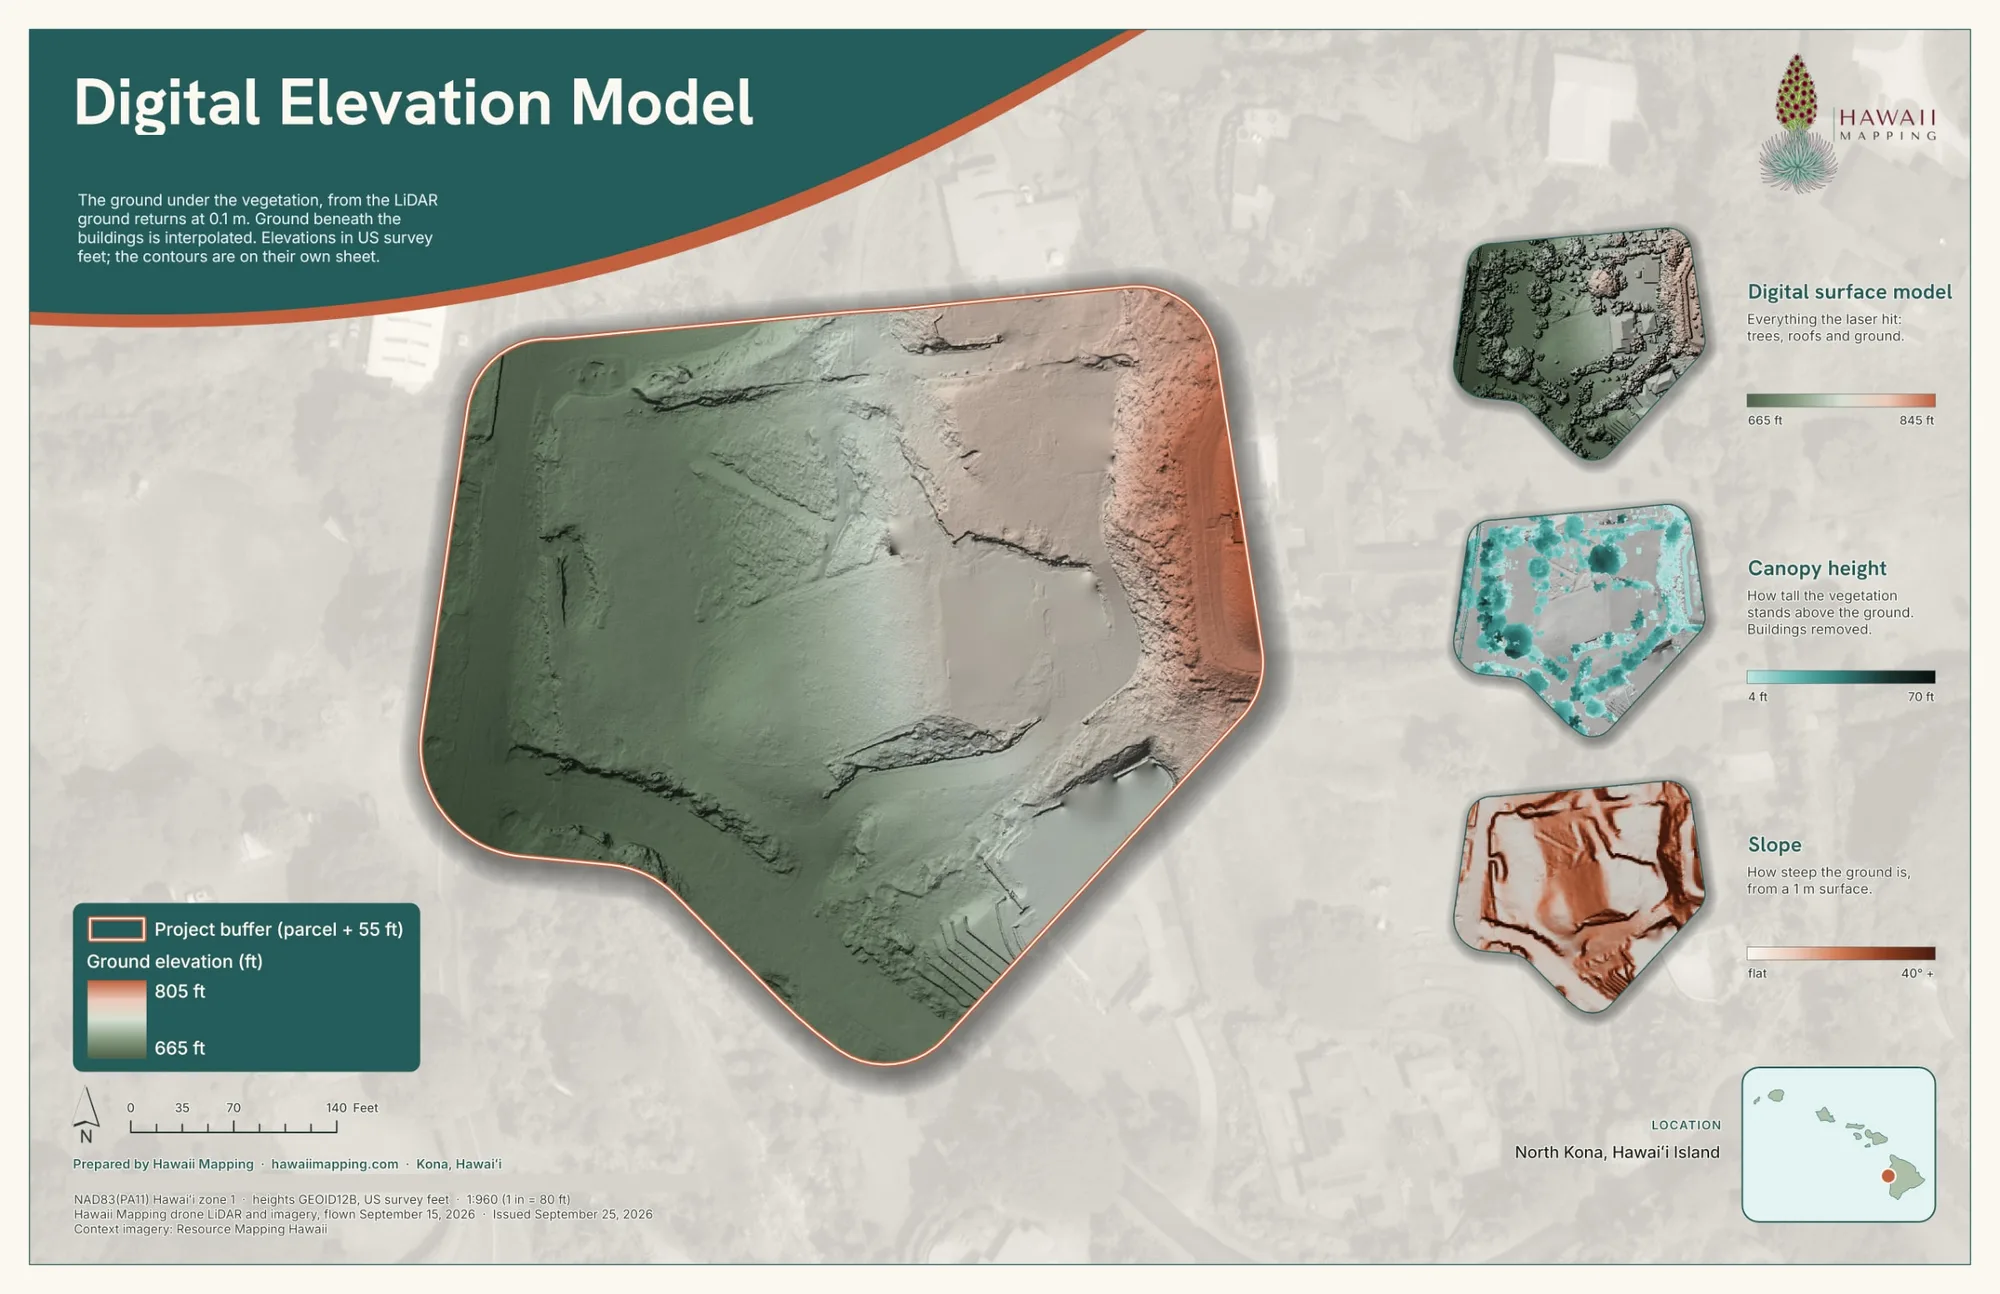
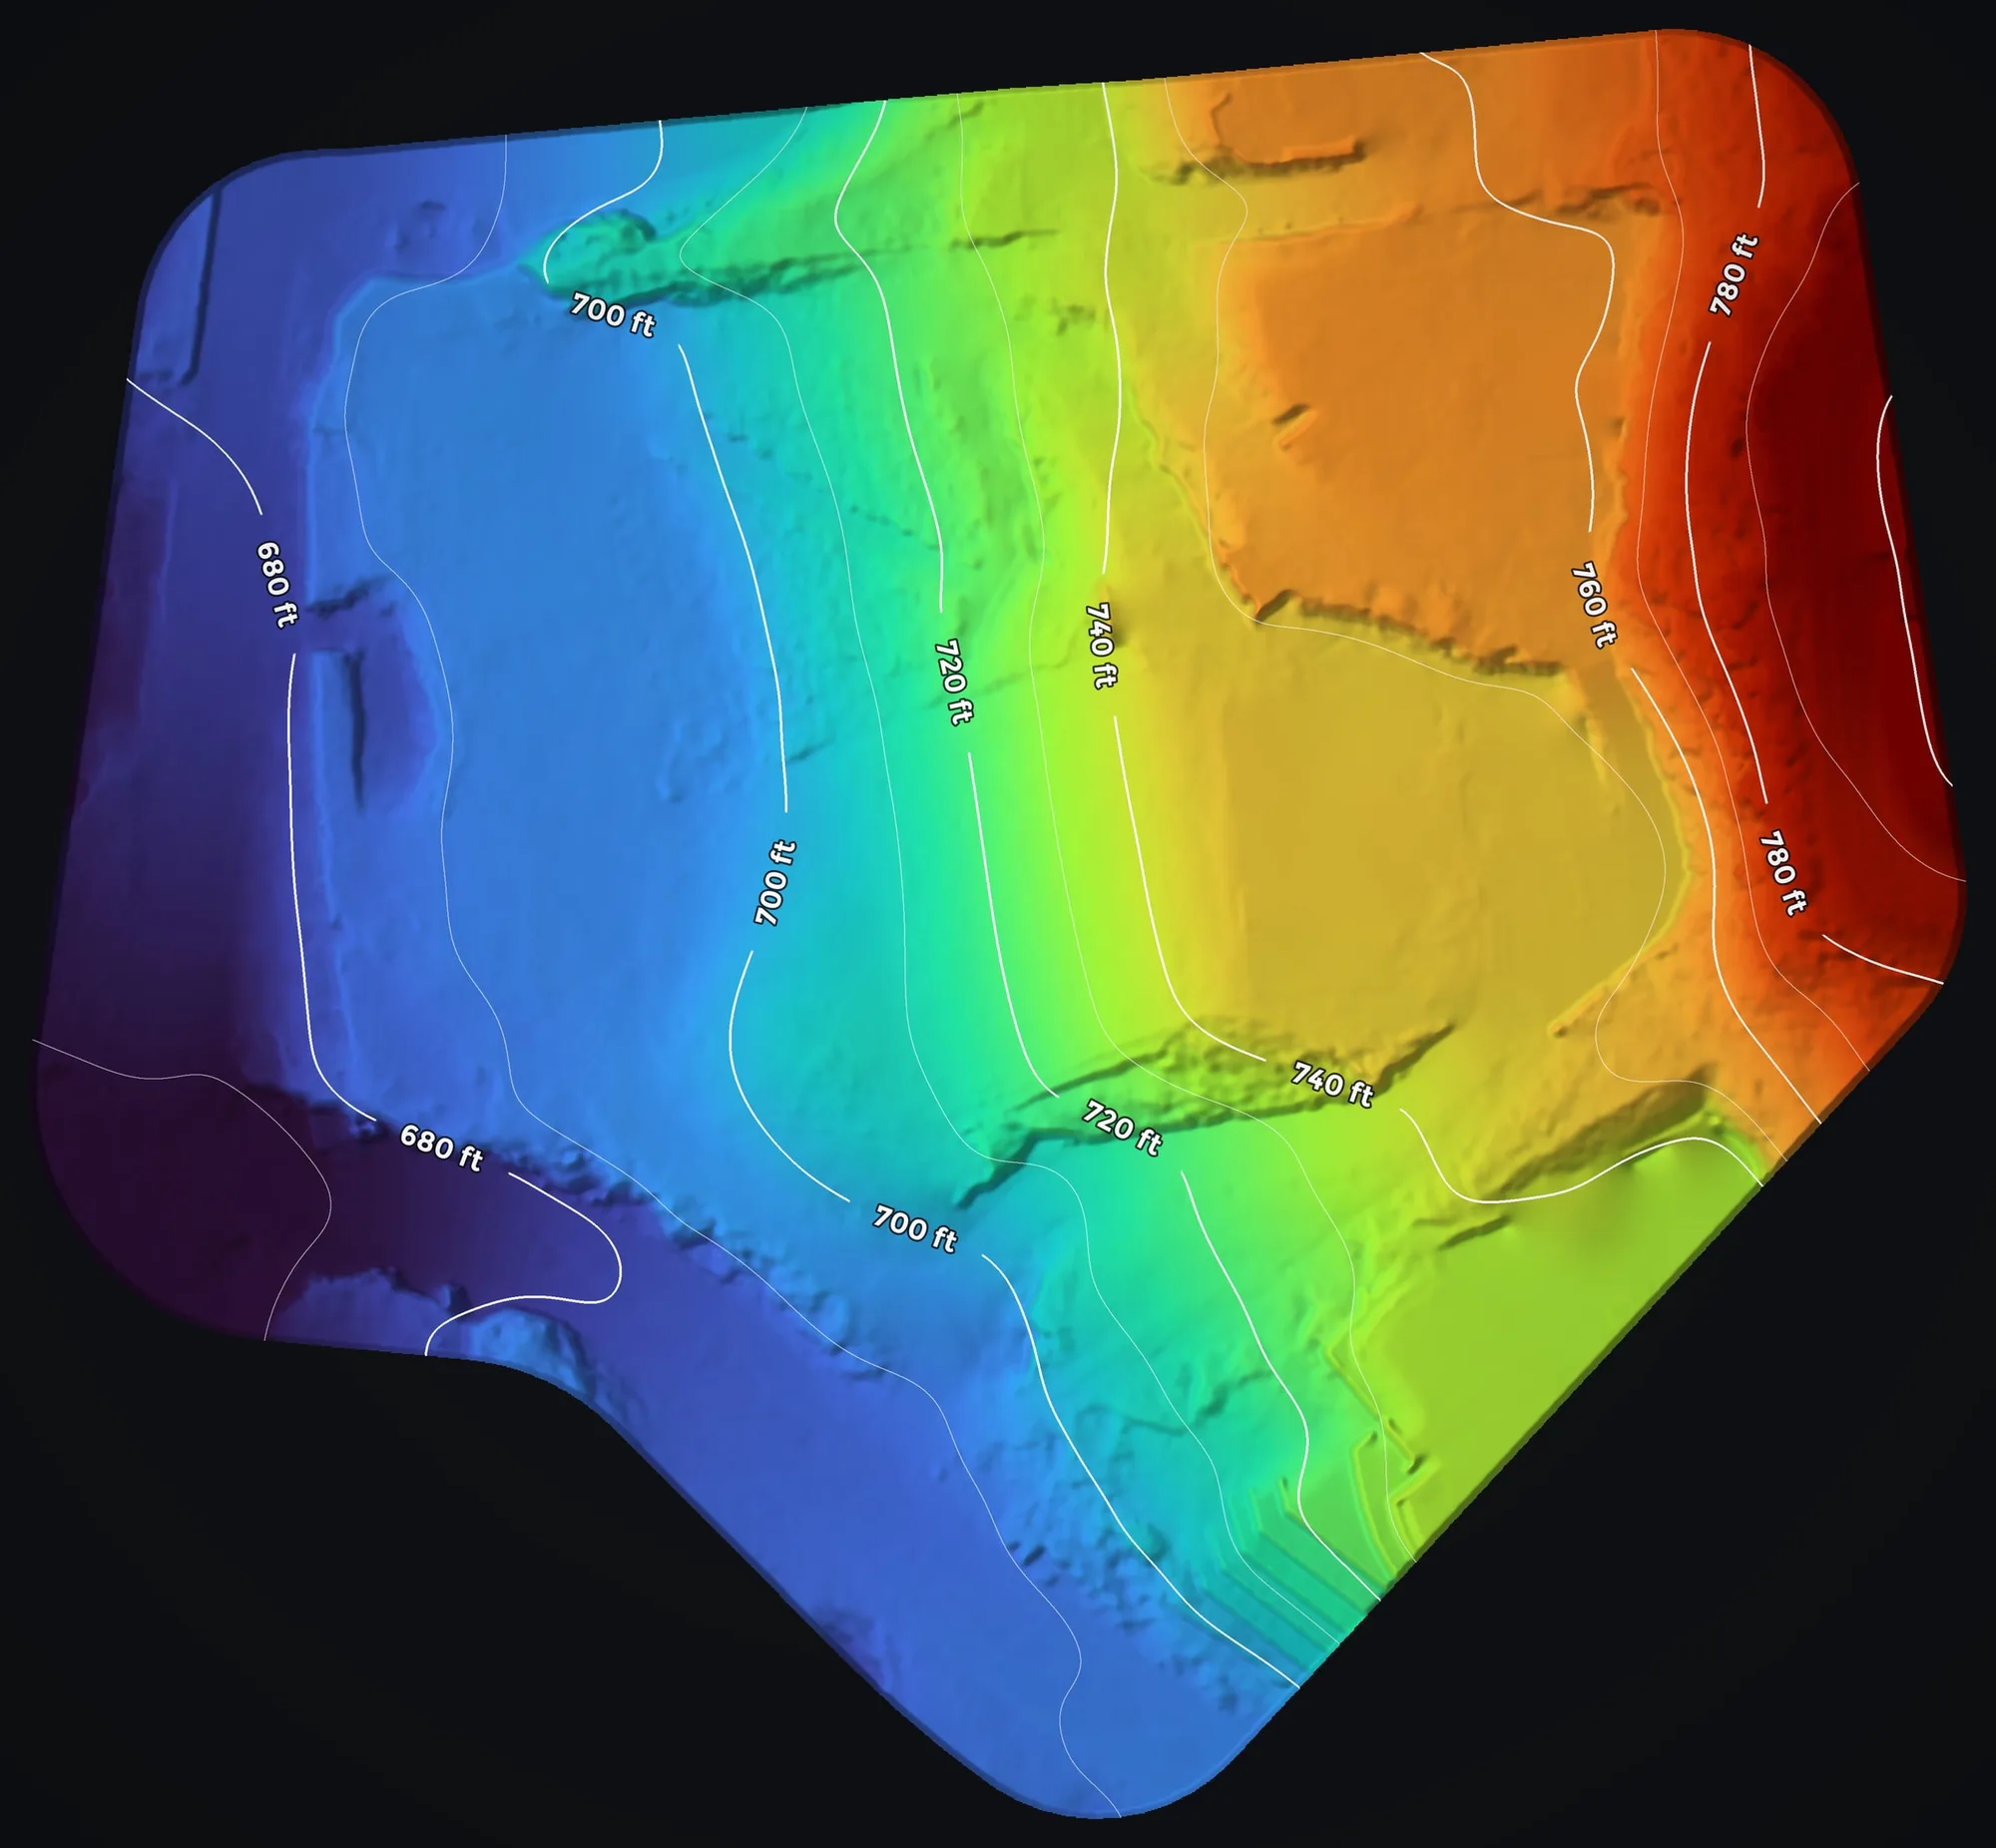
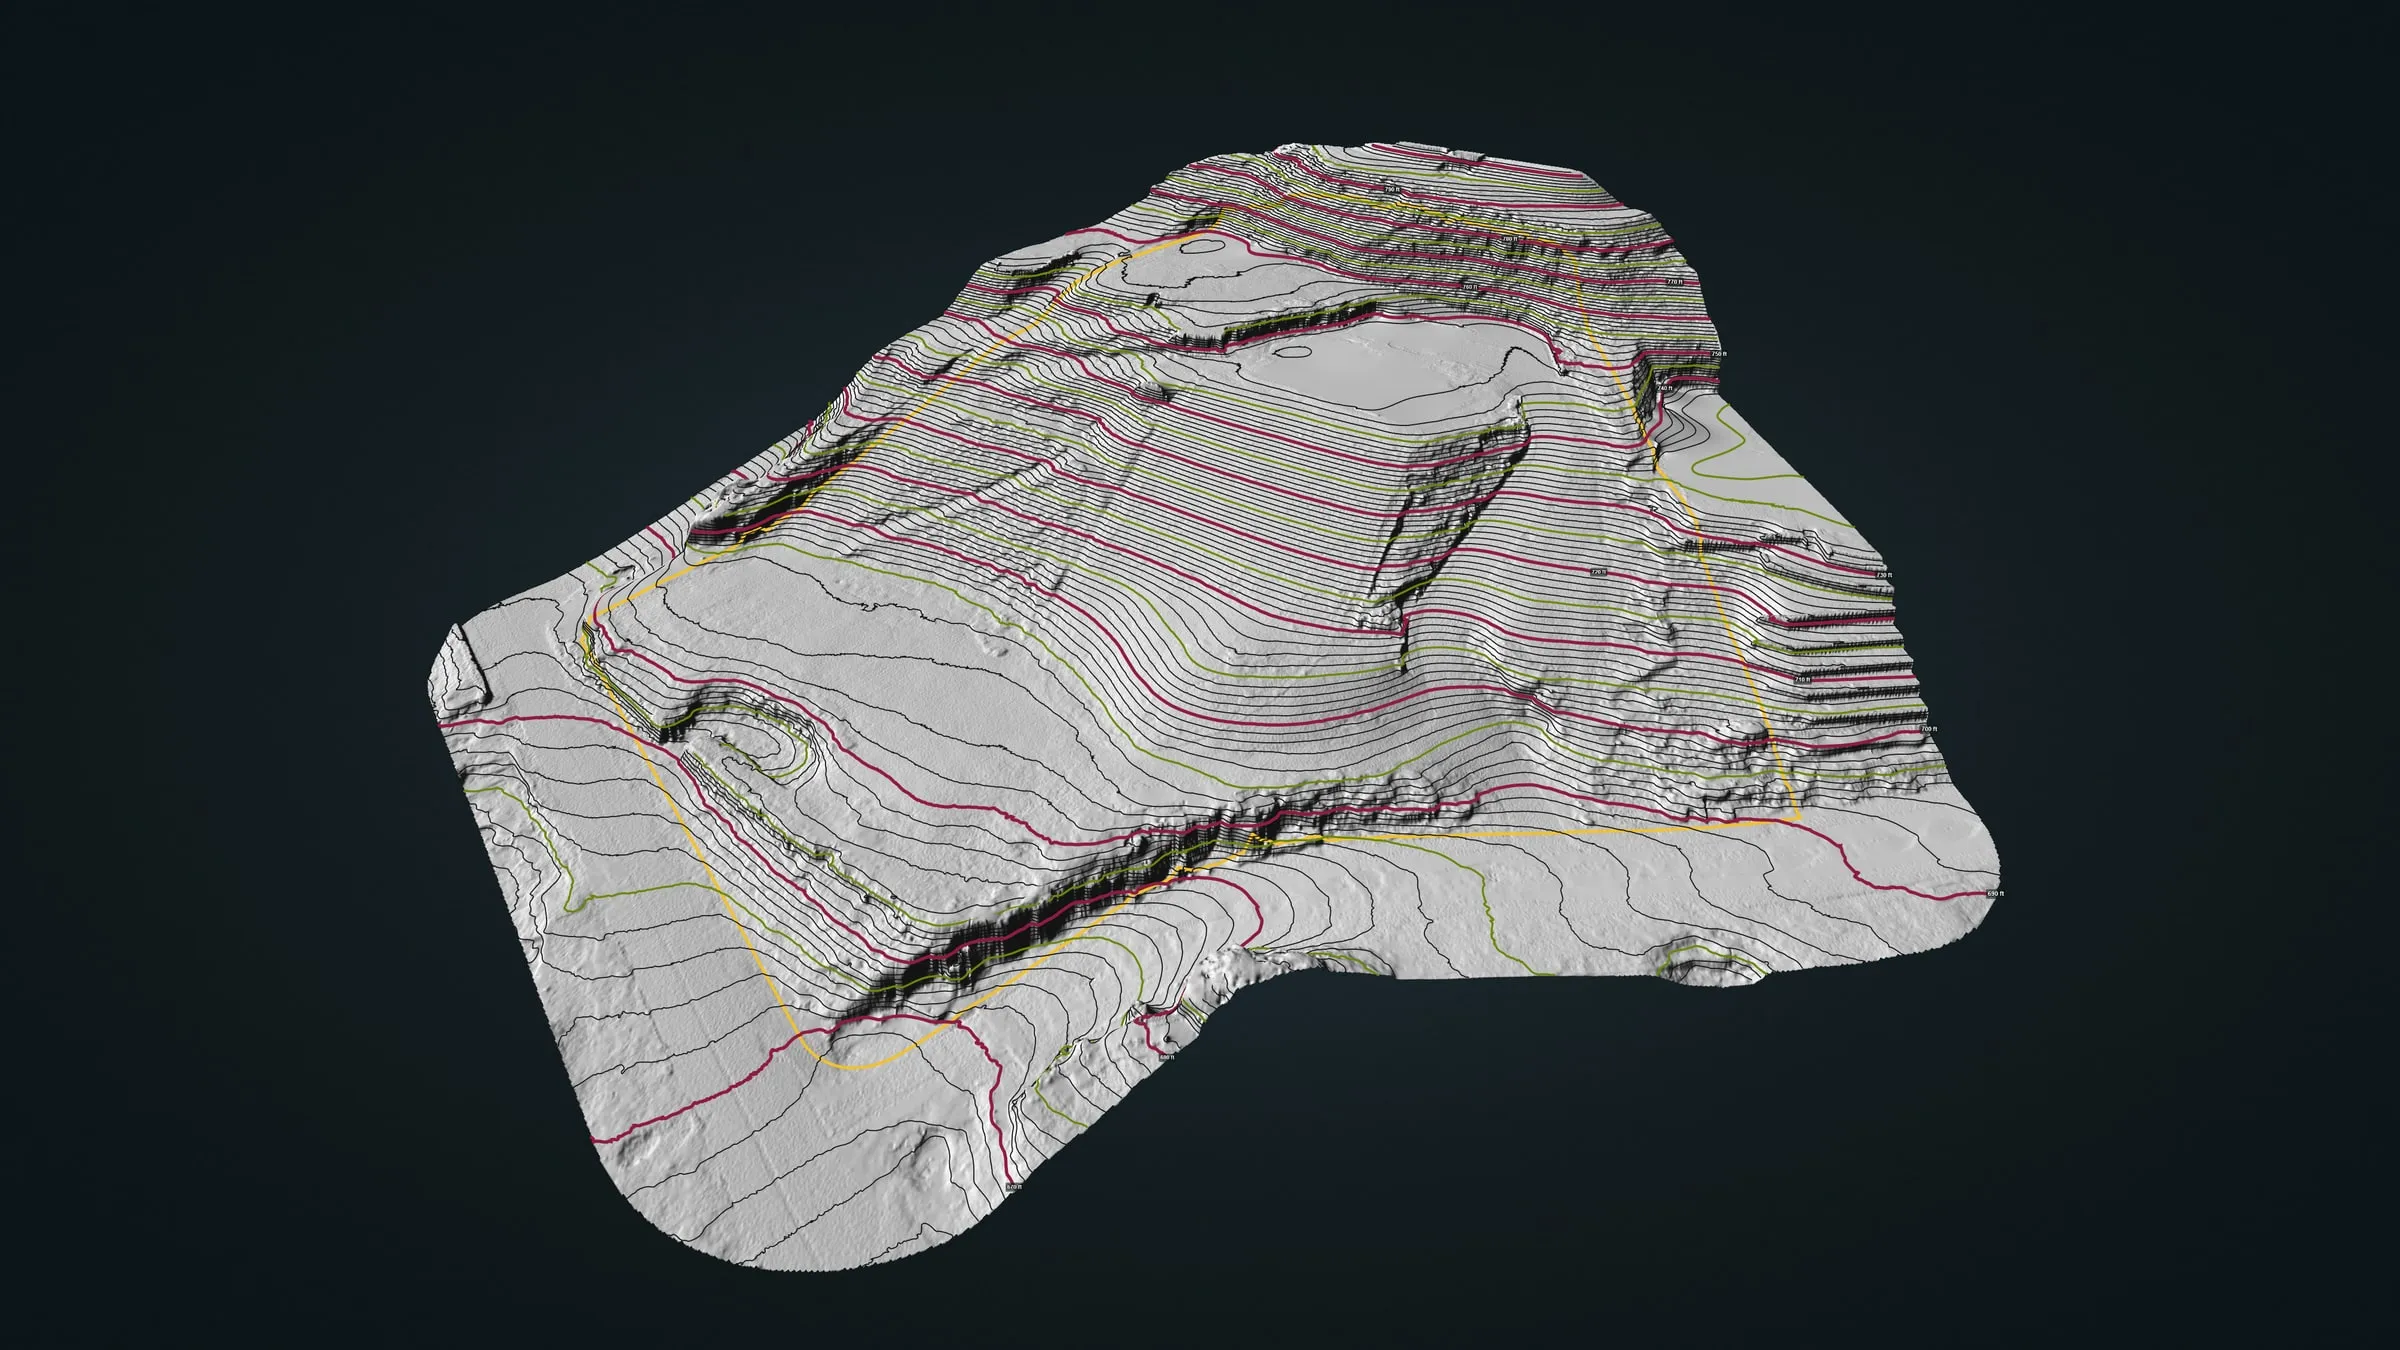 Bare earth with 1 ft contours, trees and roofs removed
 -
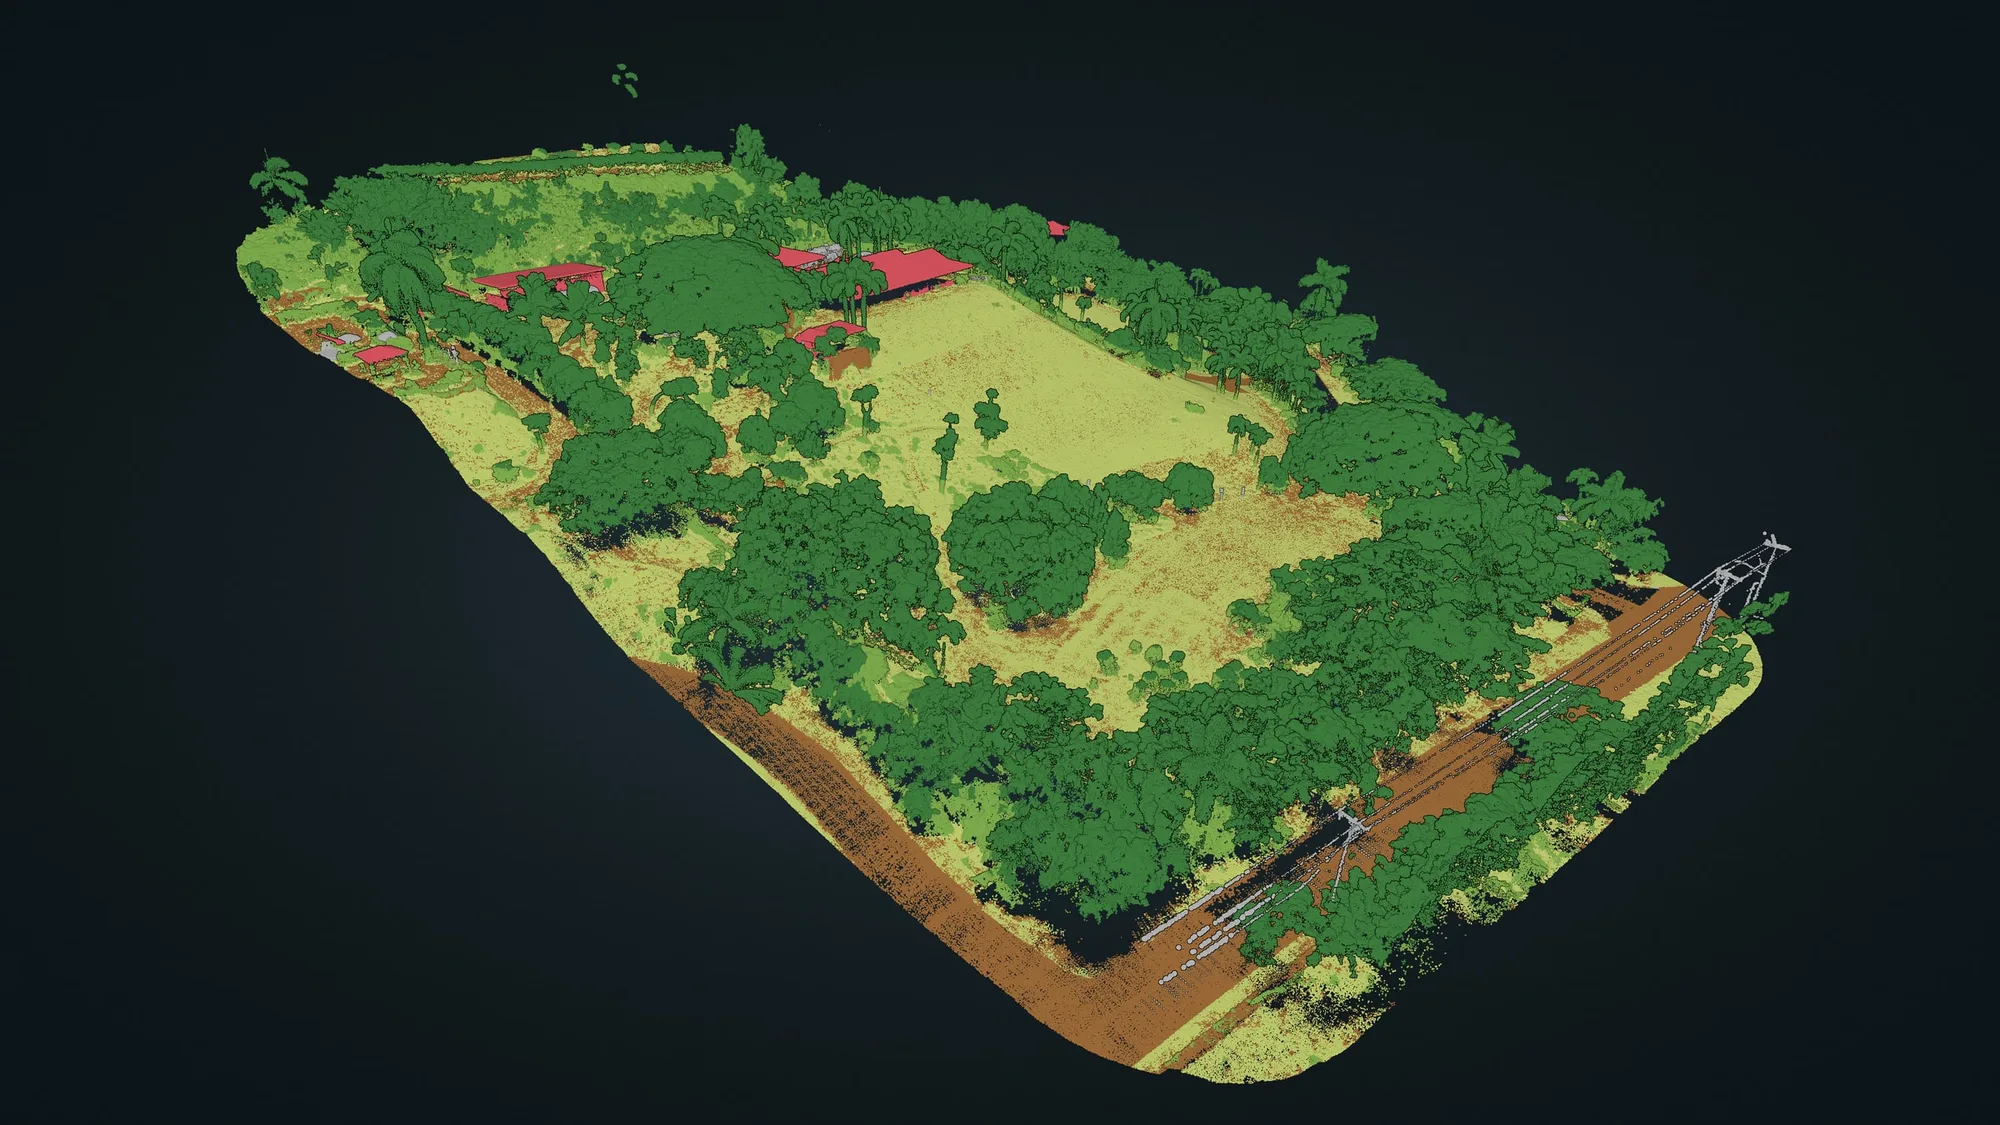
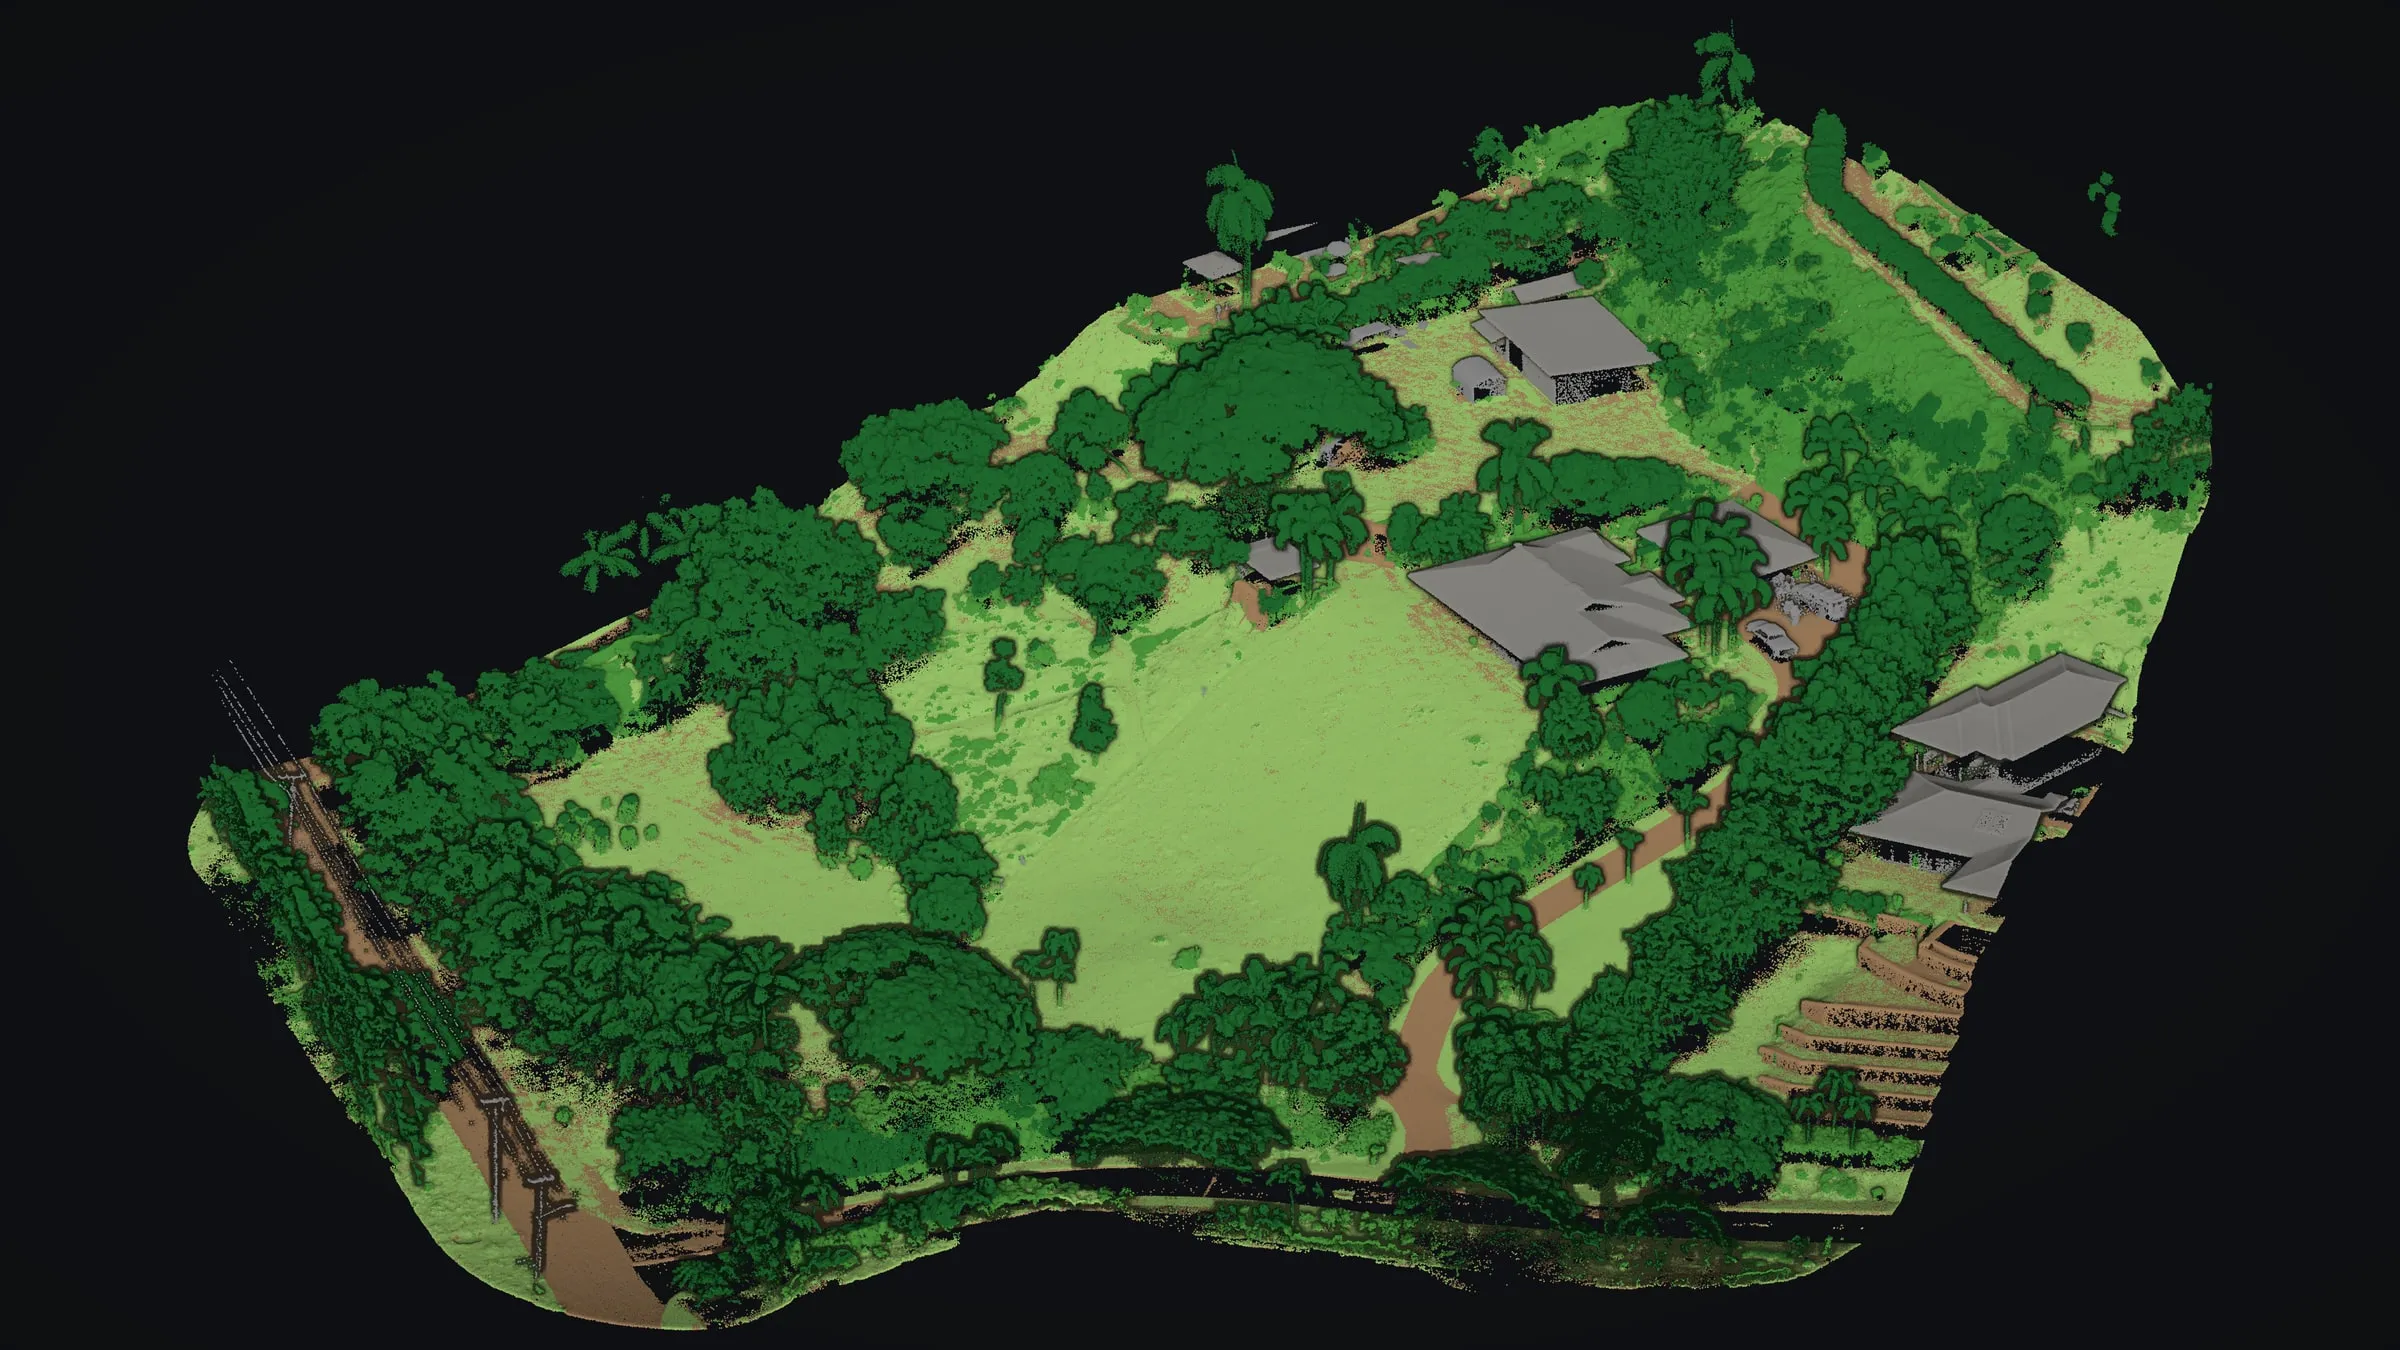 Ground, trees and buildings, each in its own class
 -
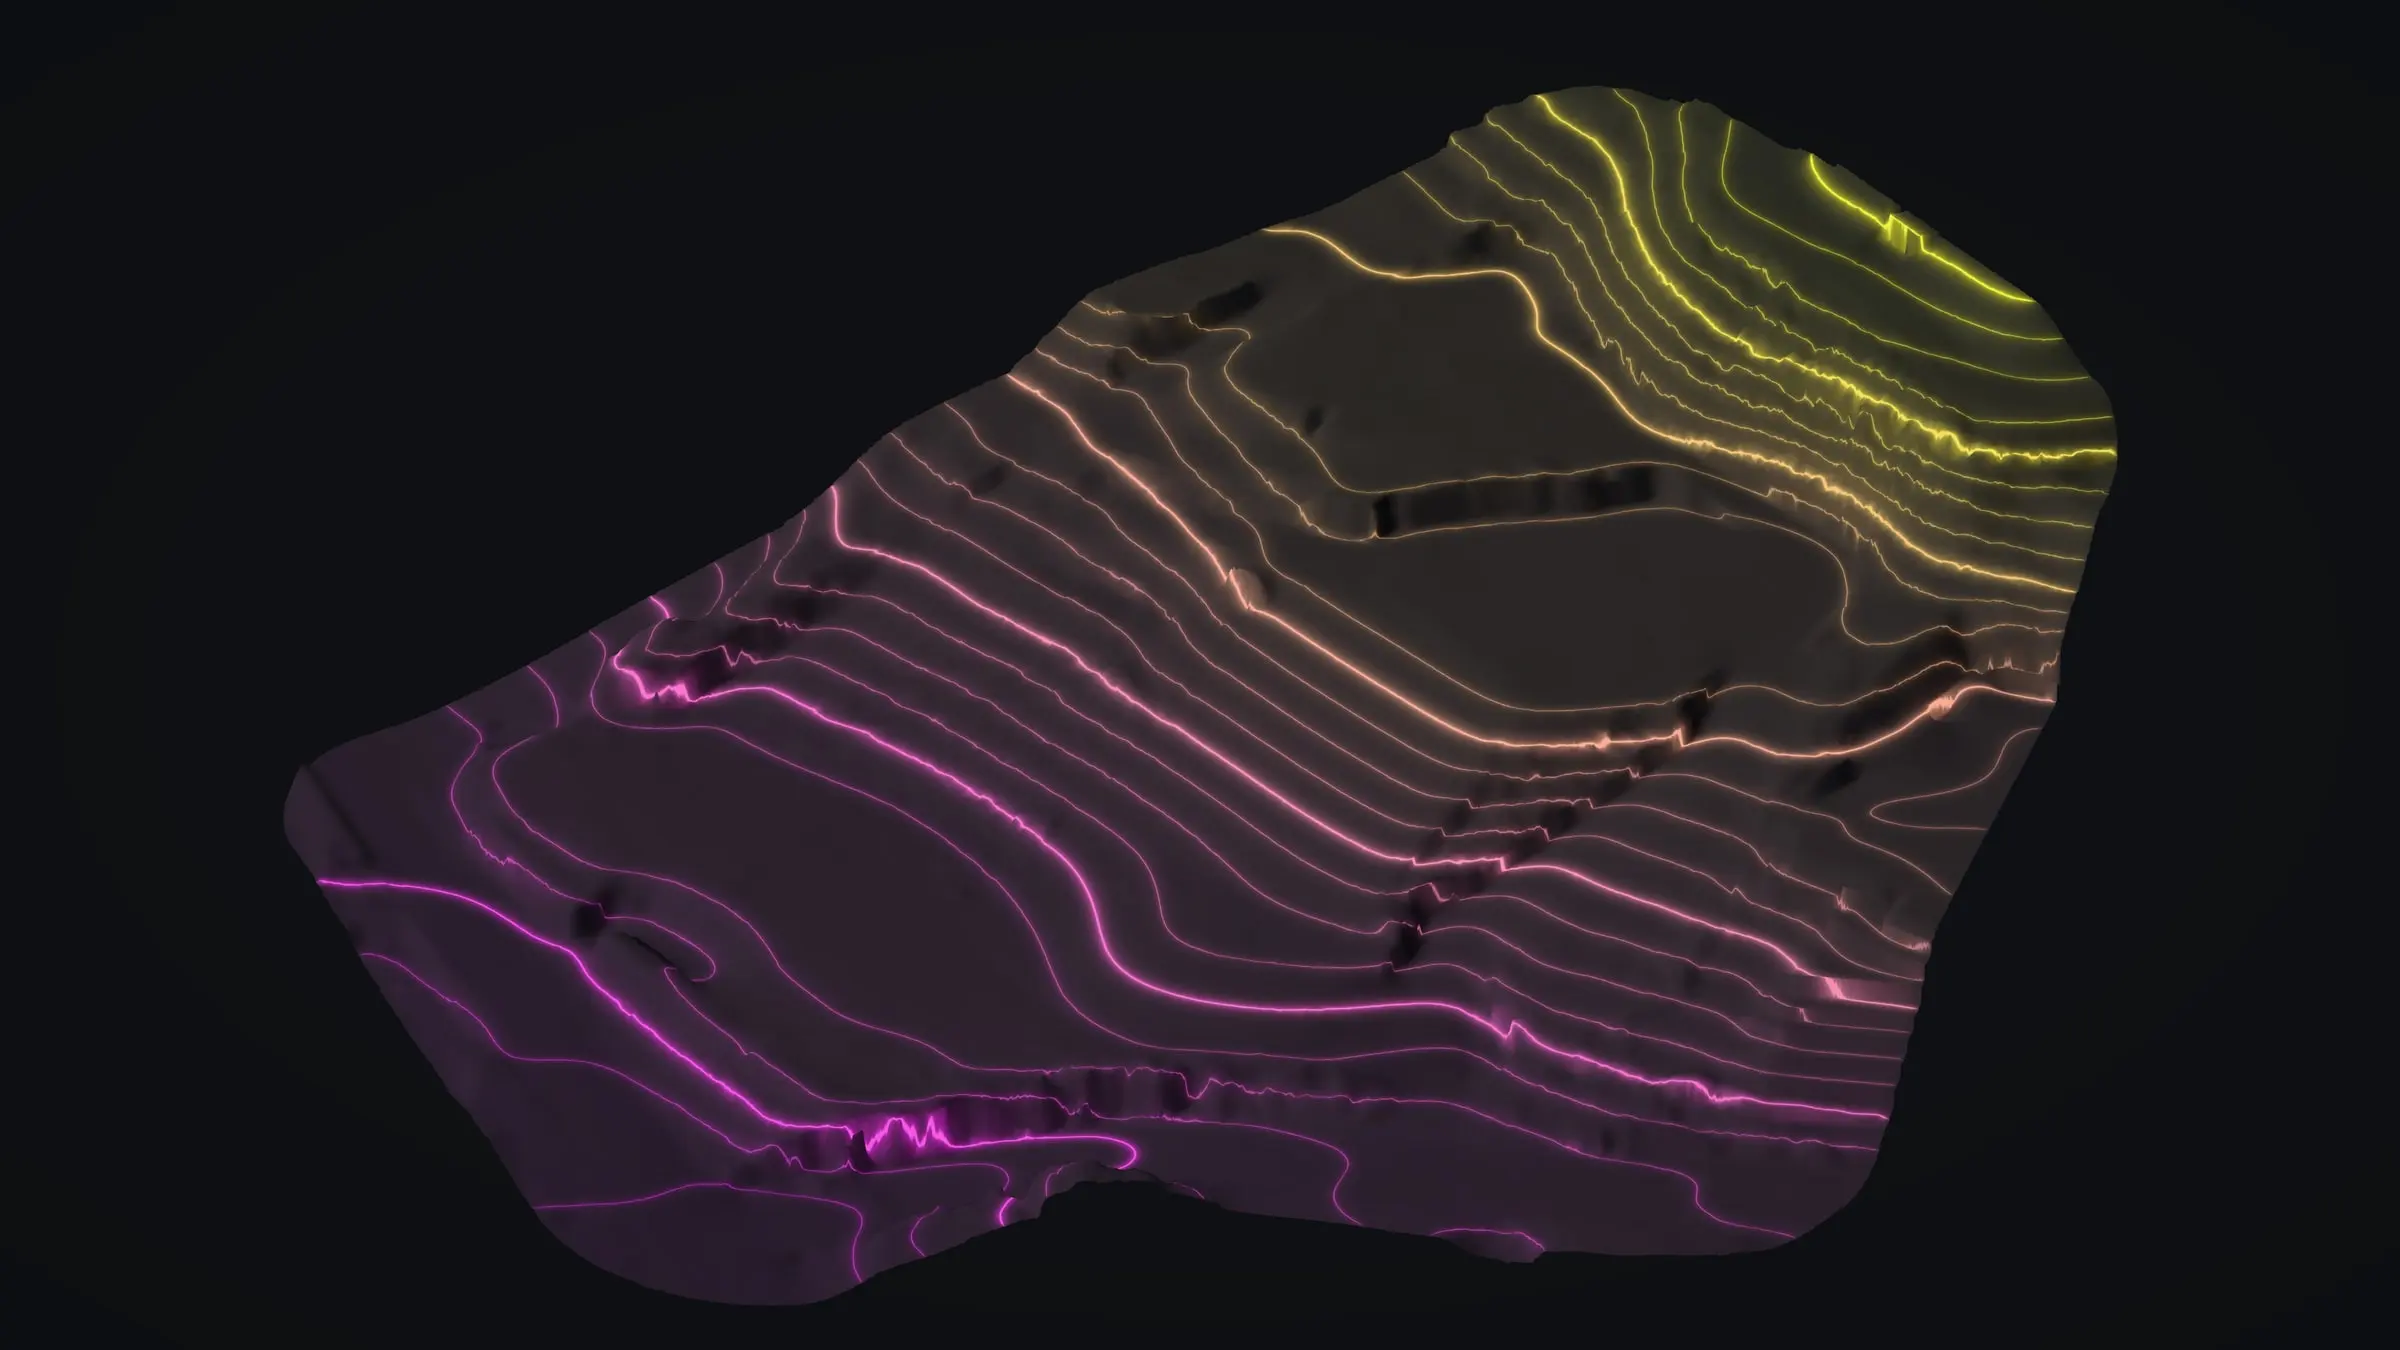
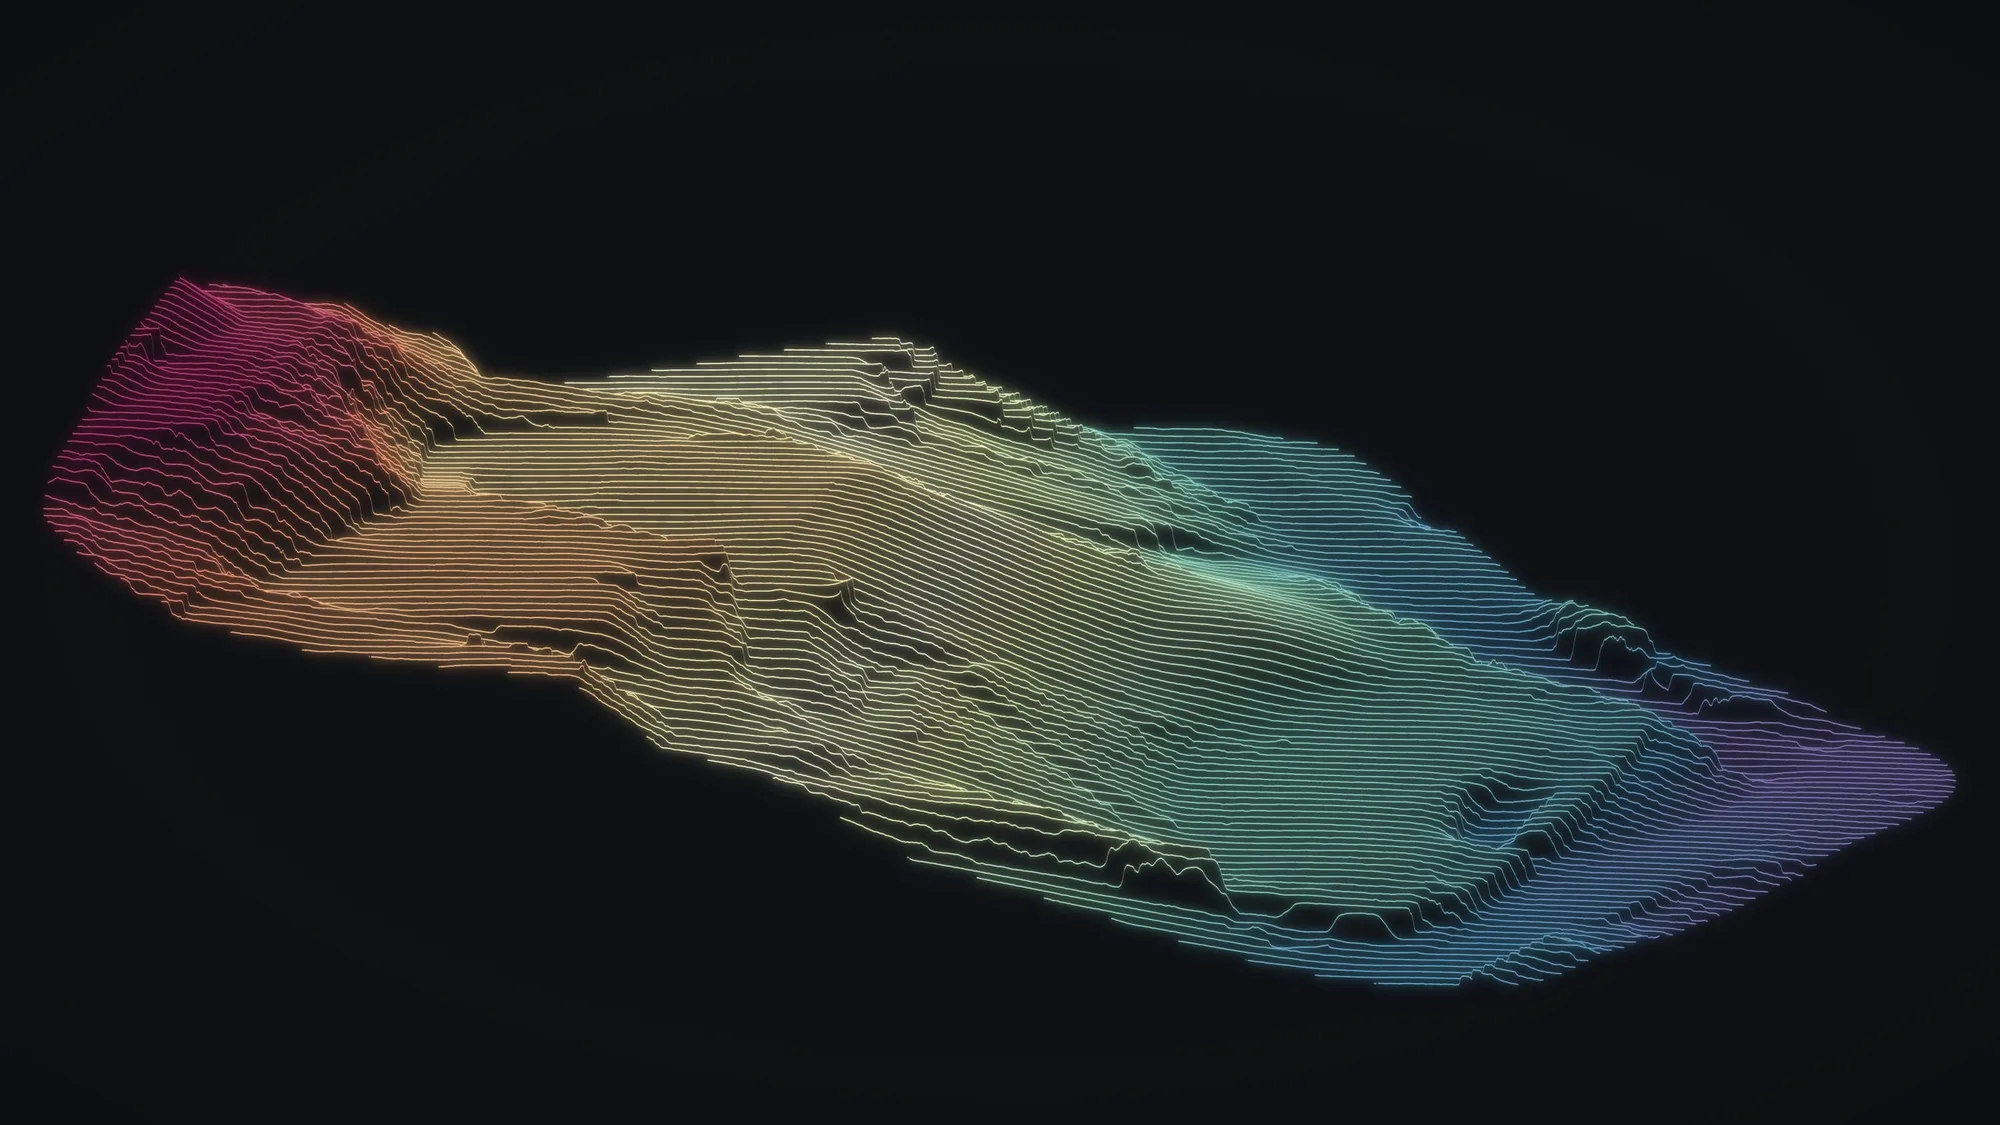
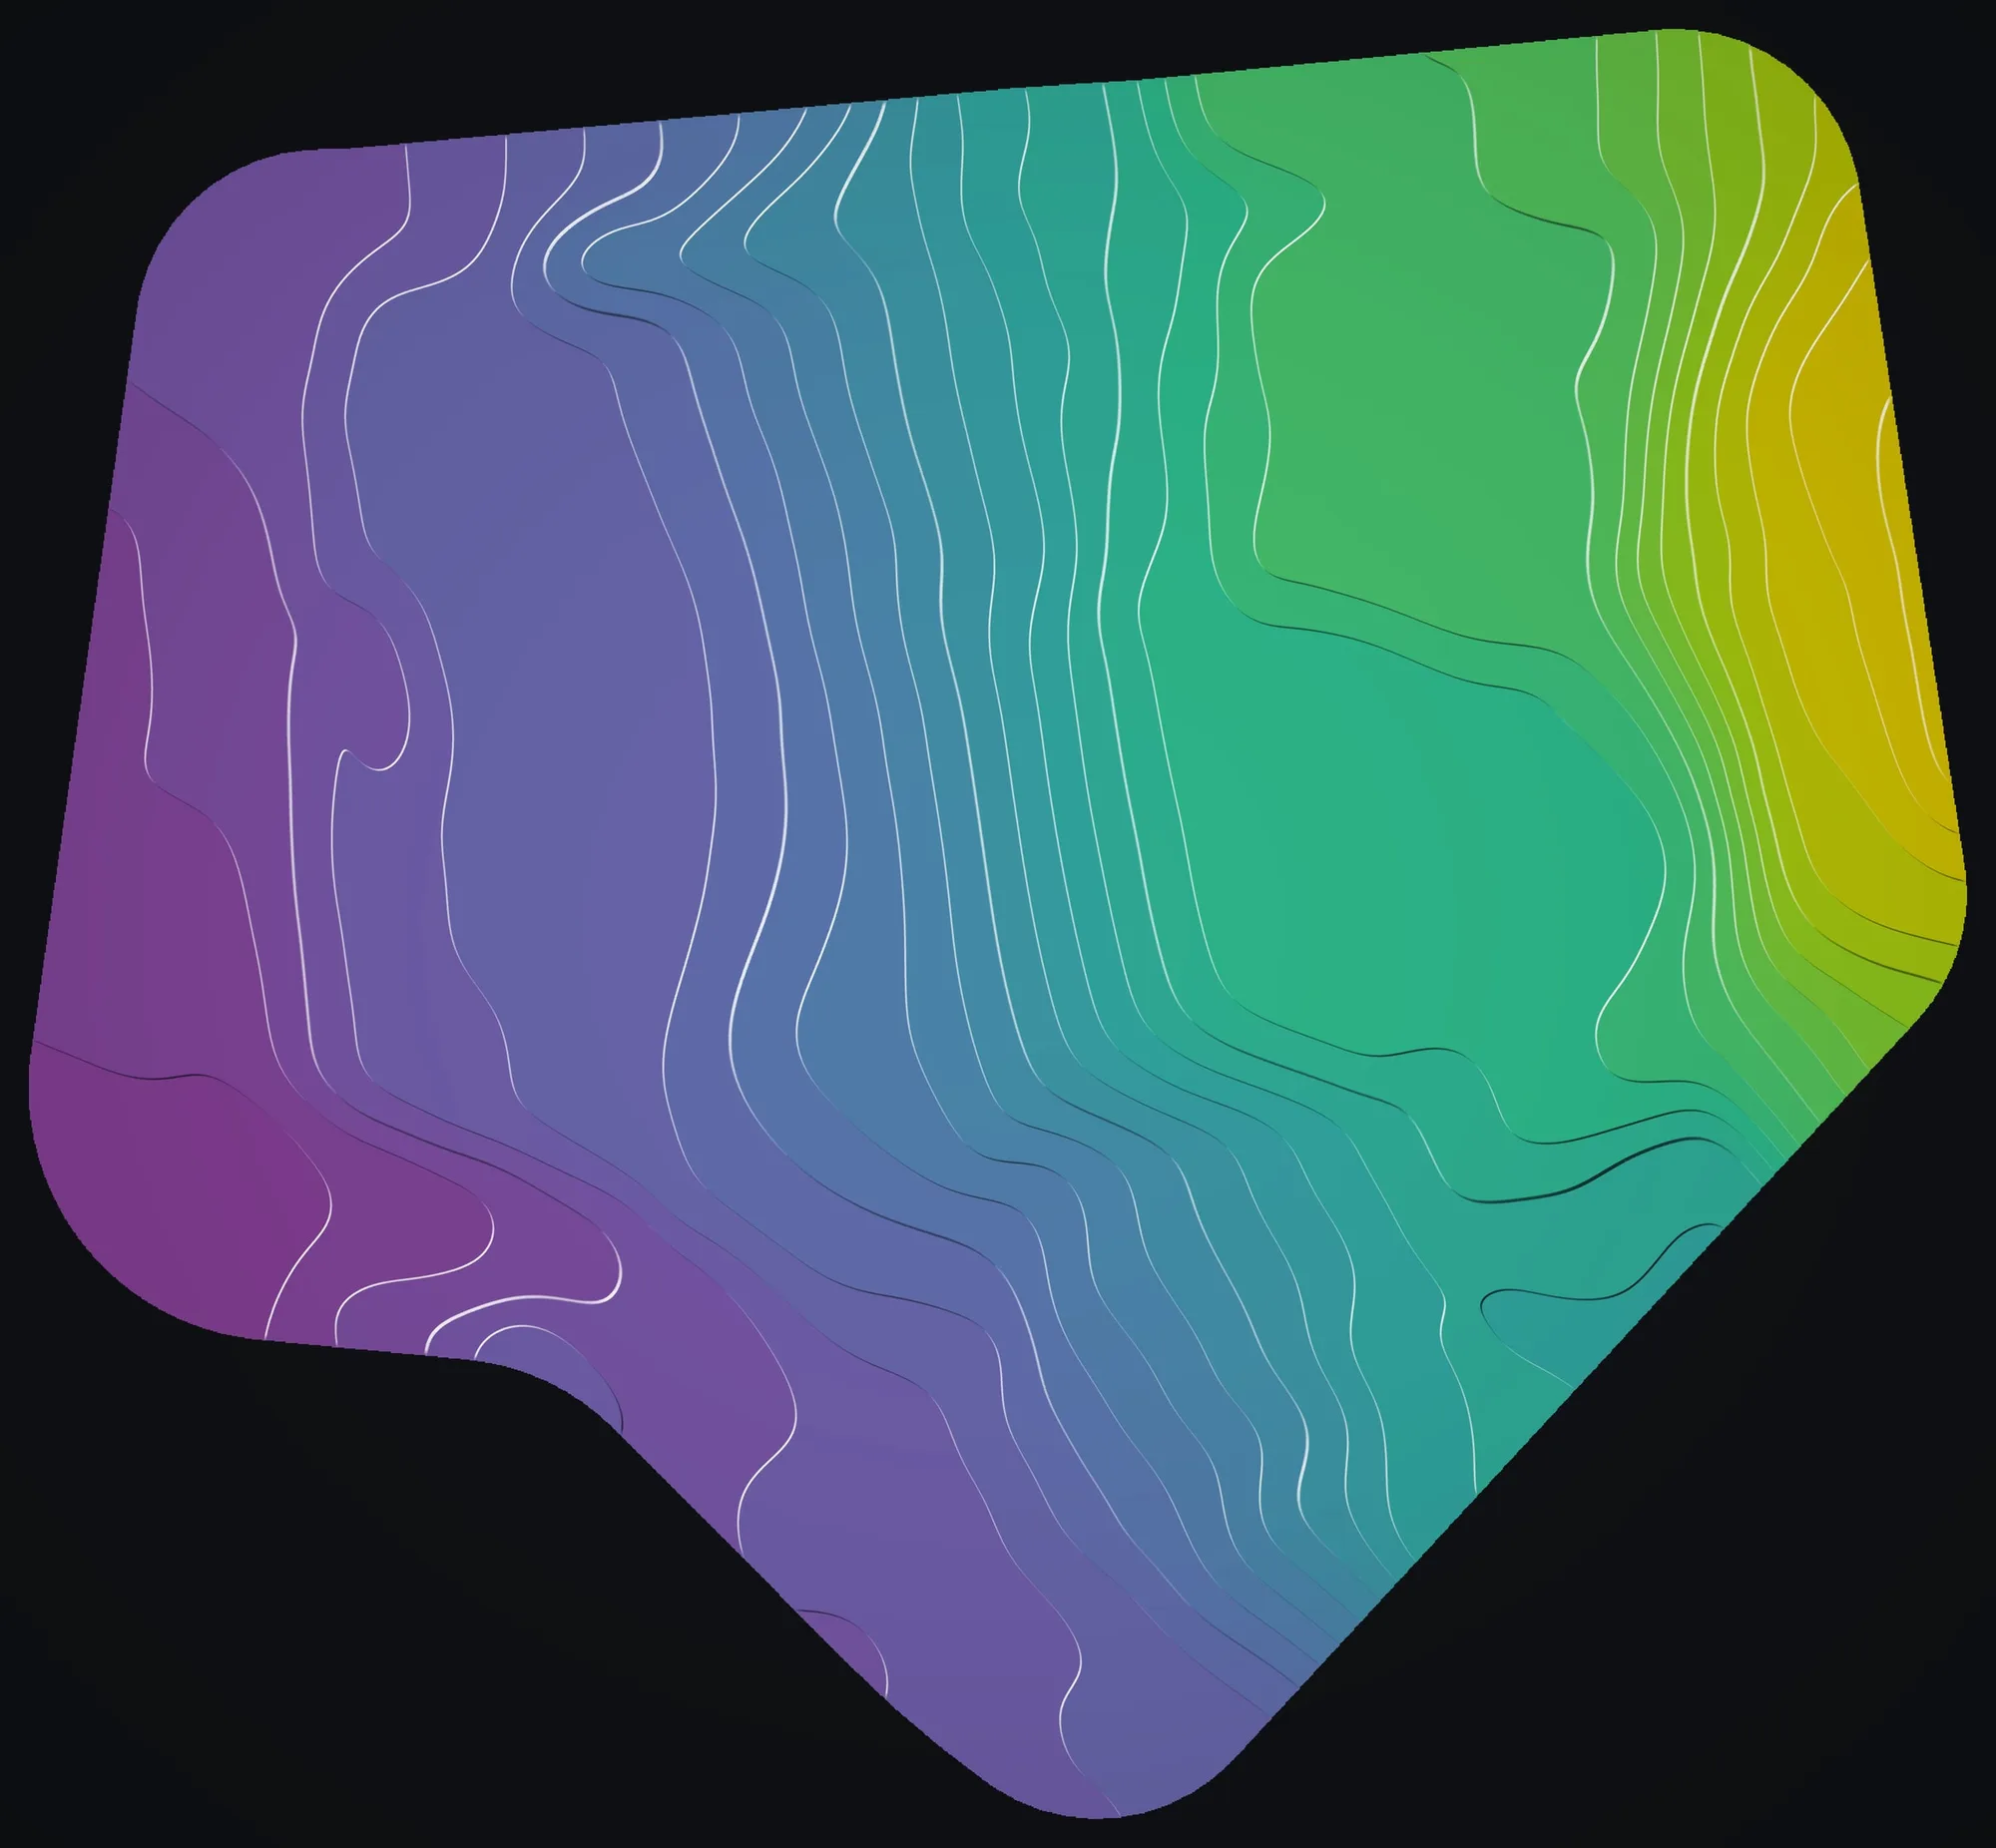
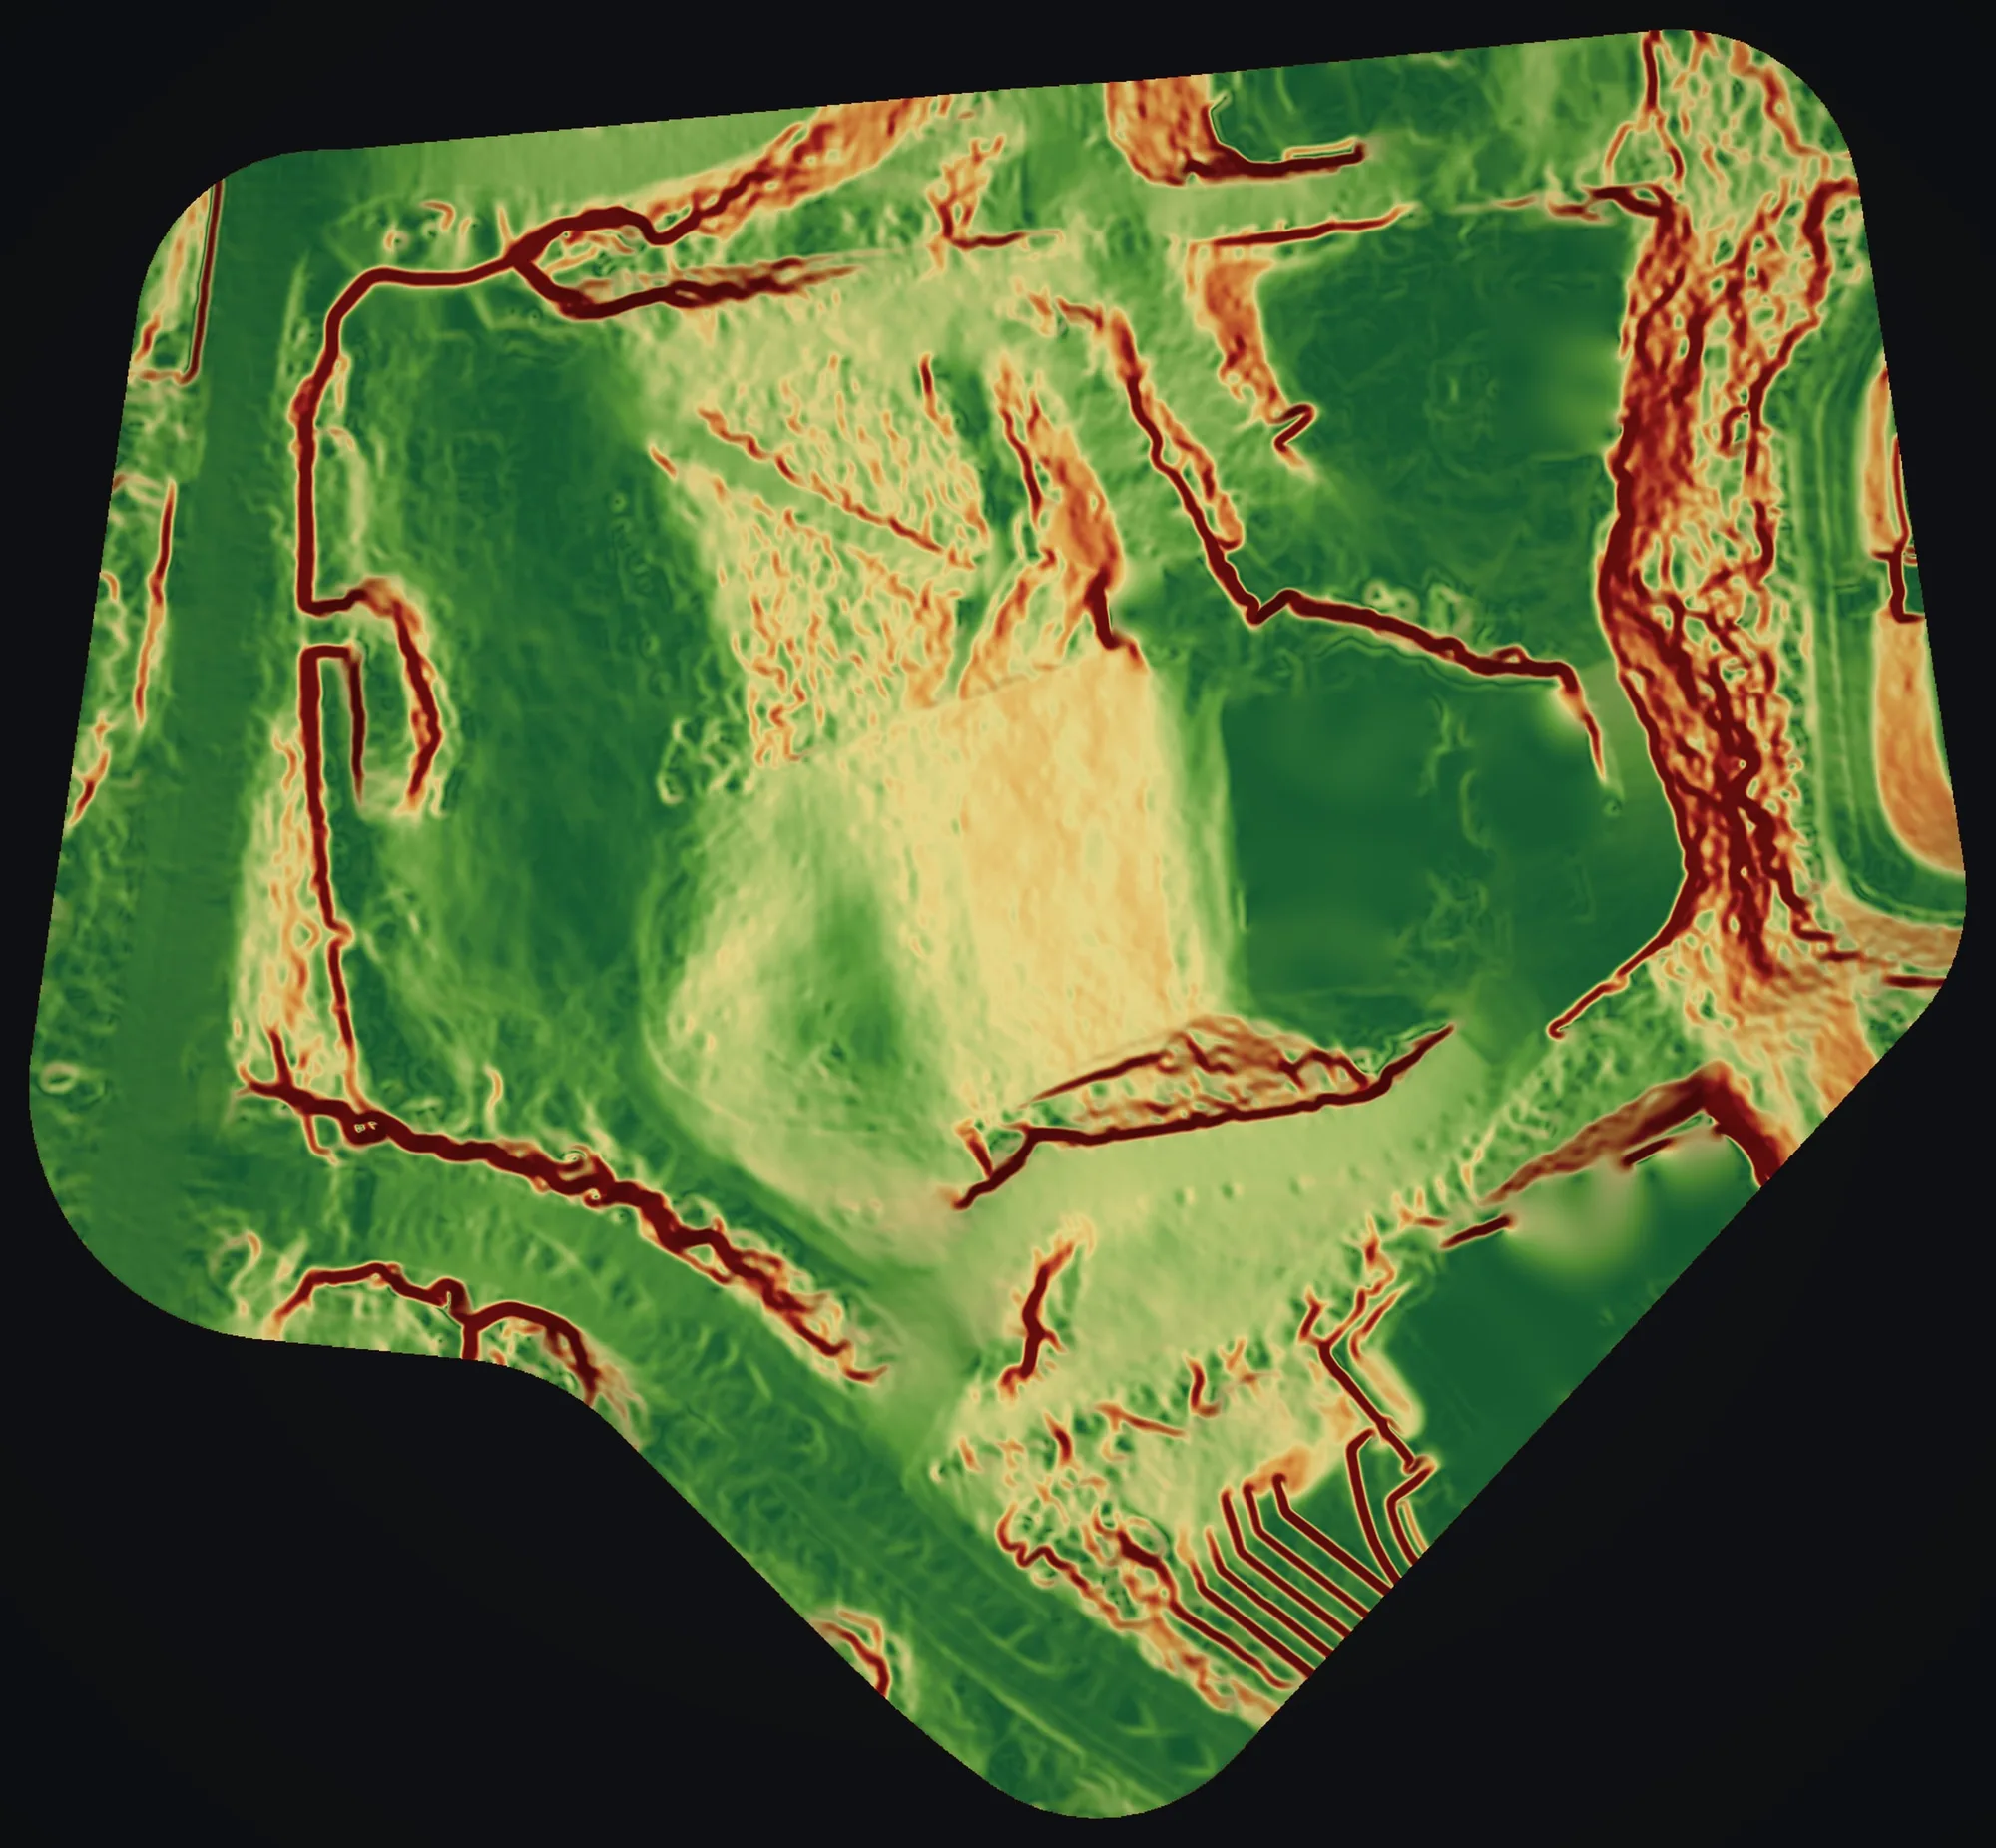
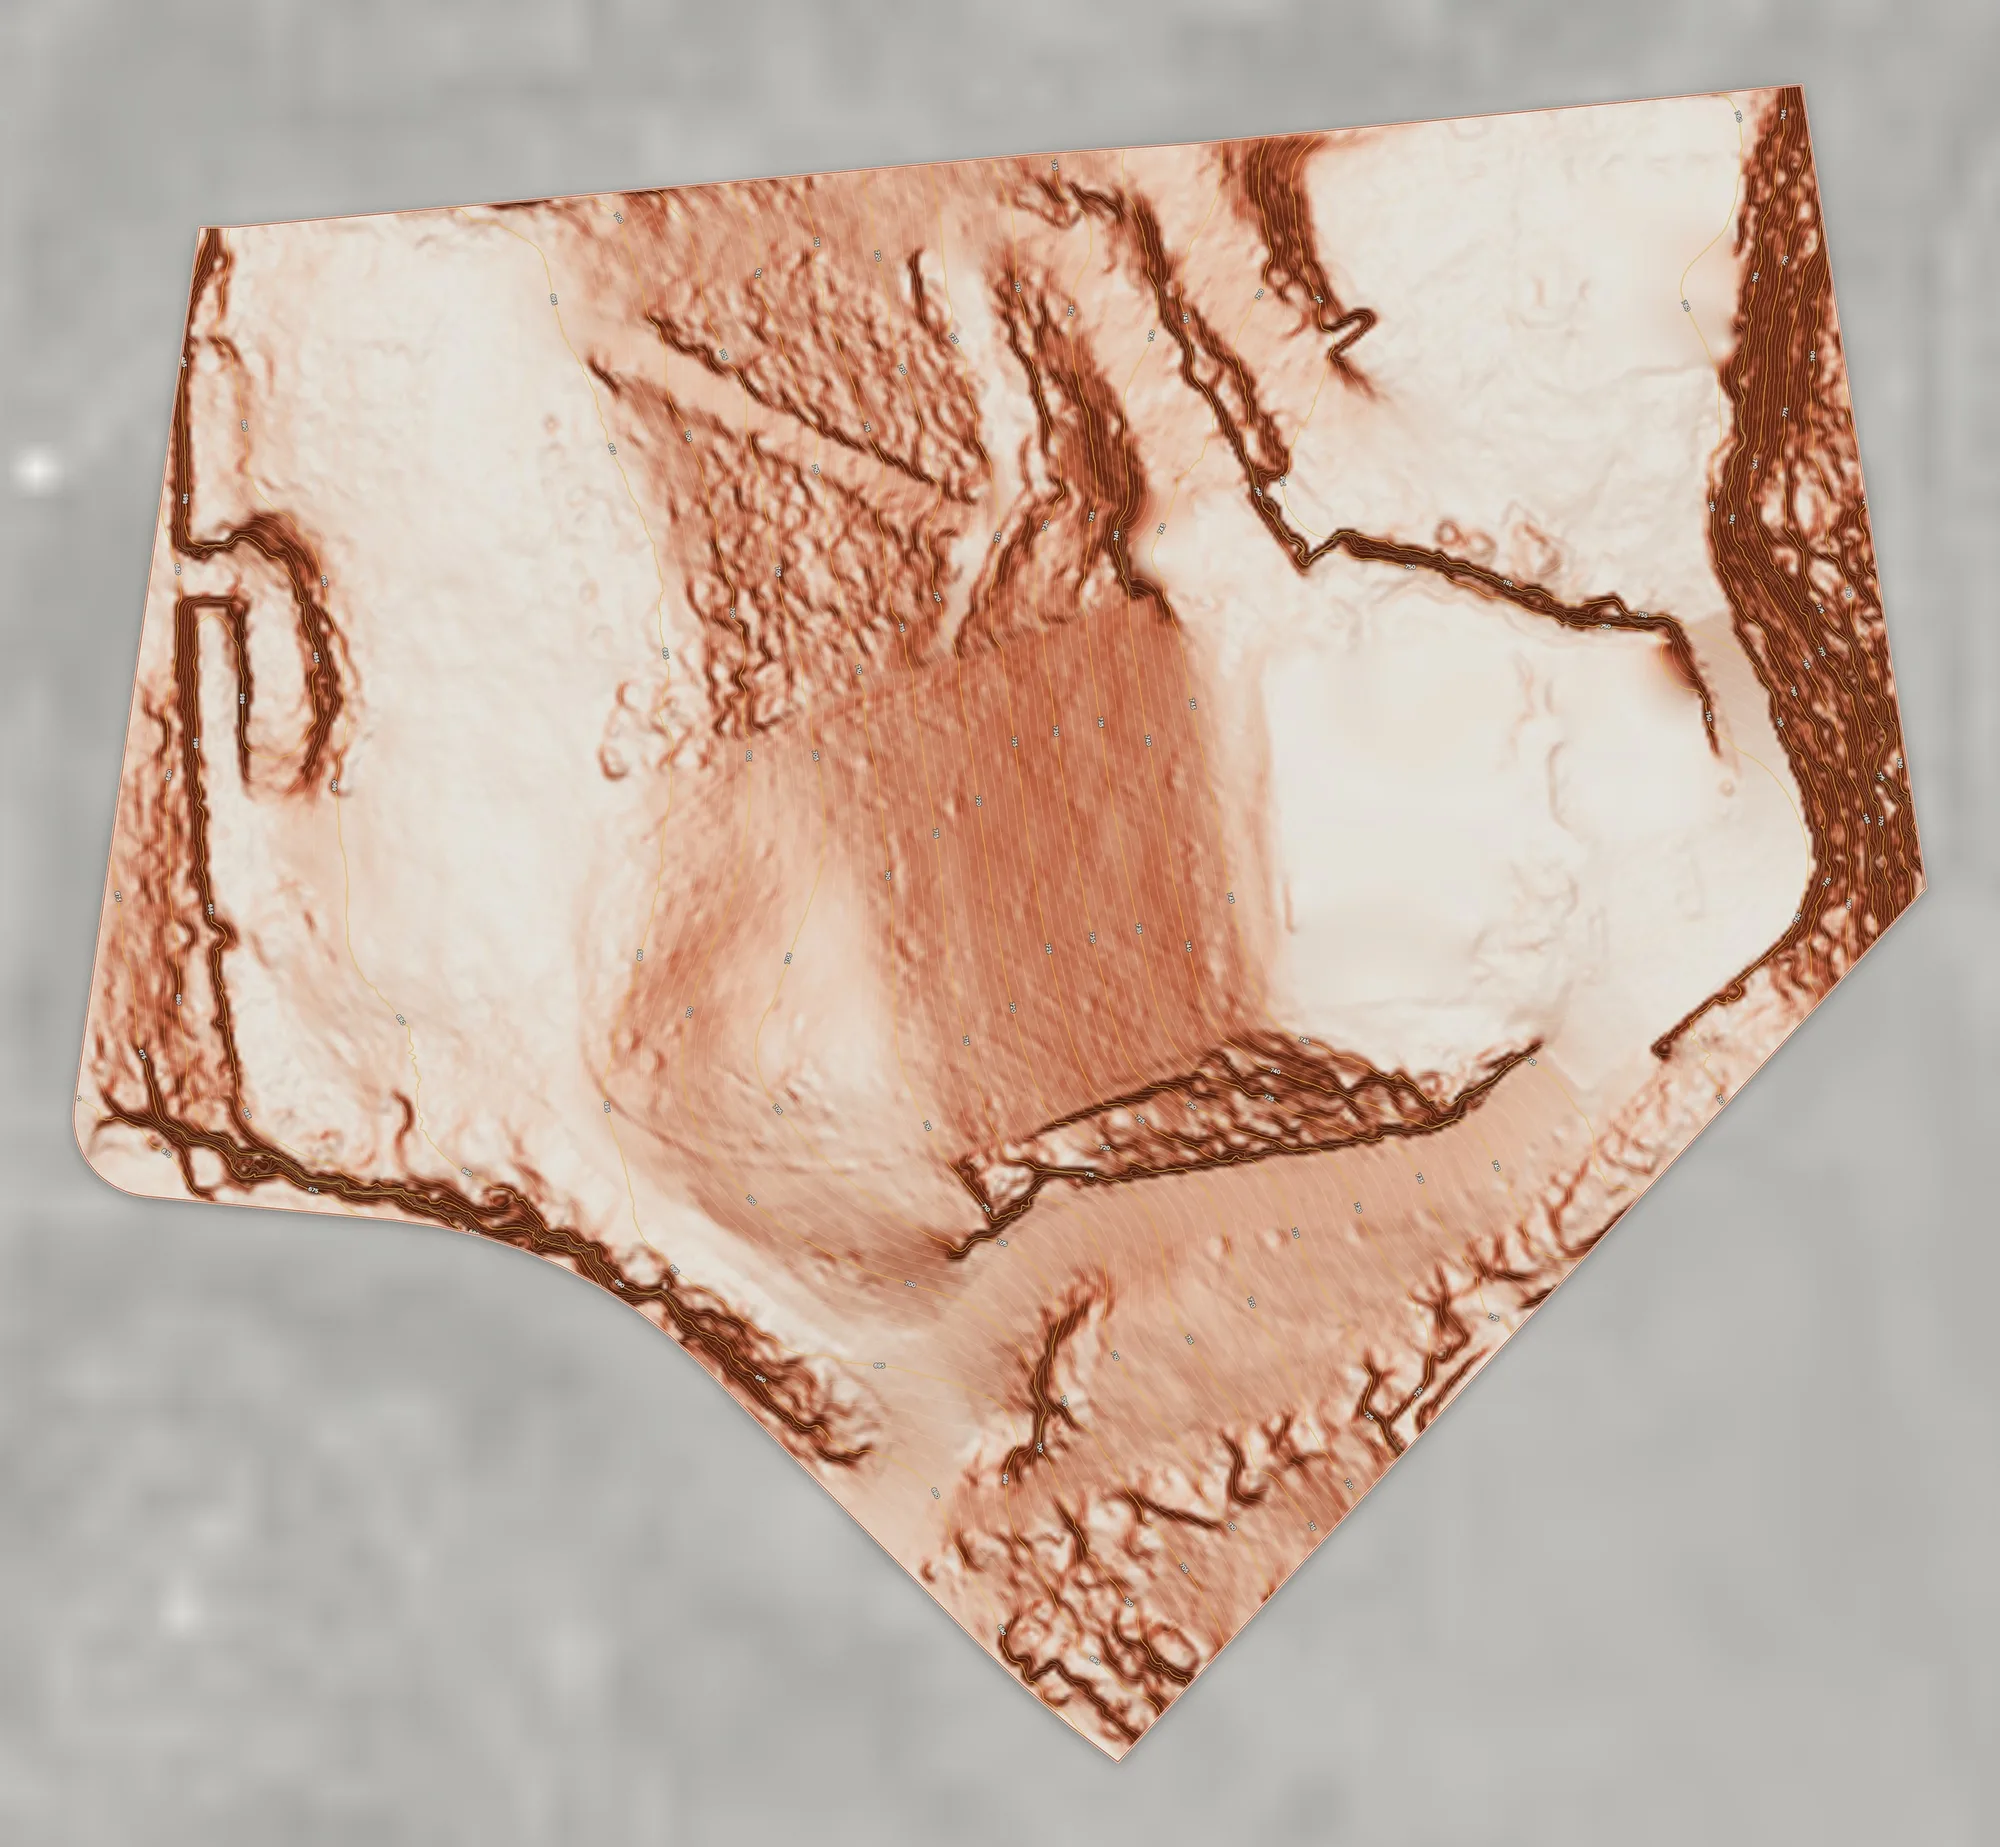
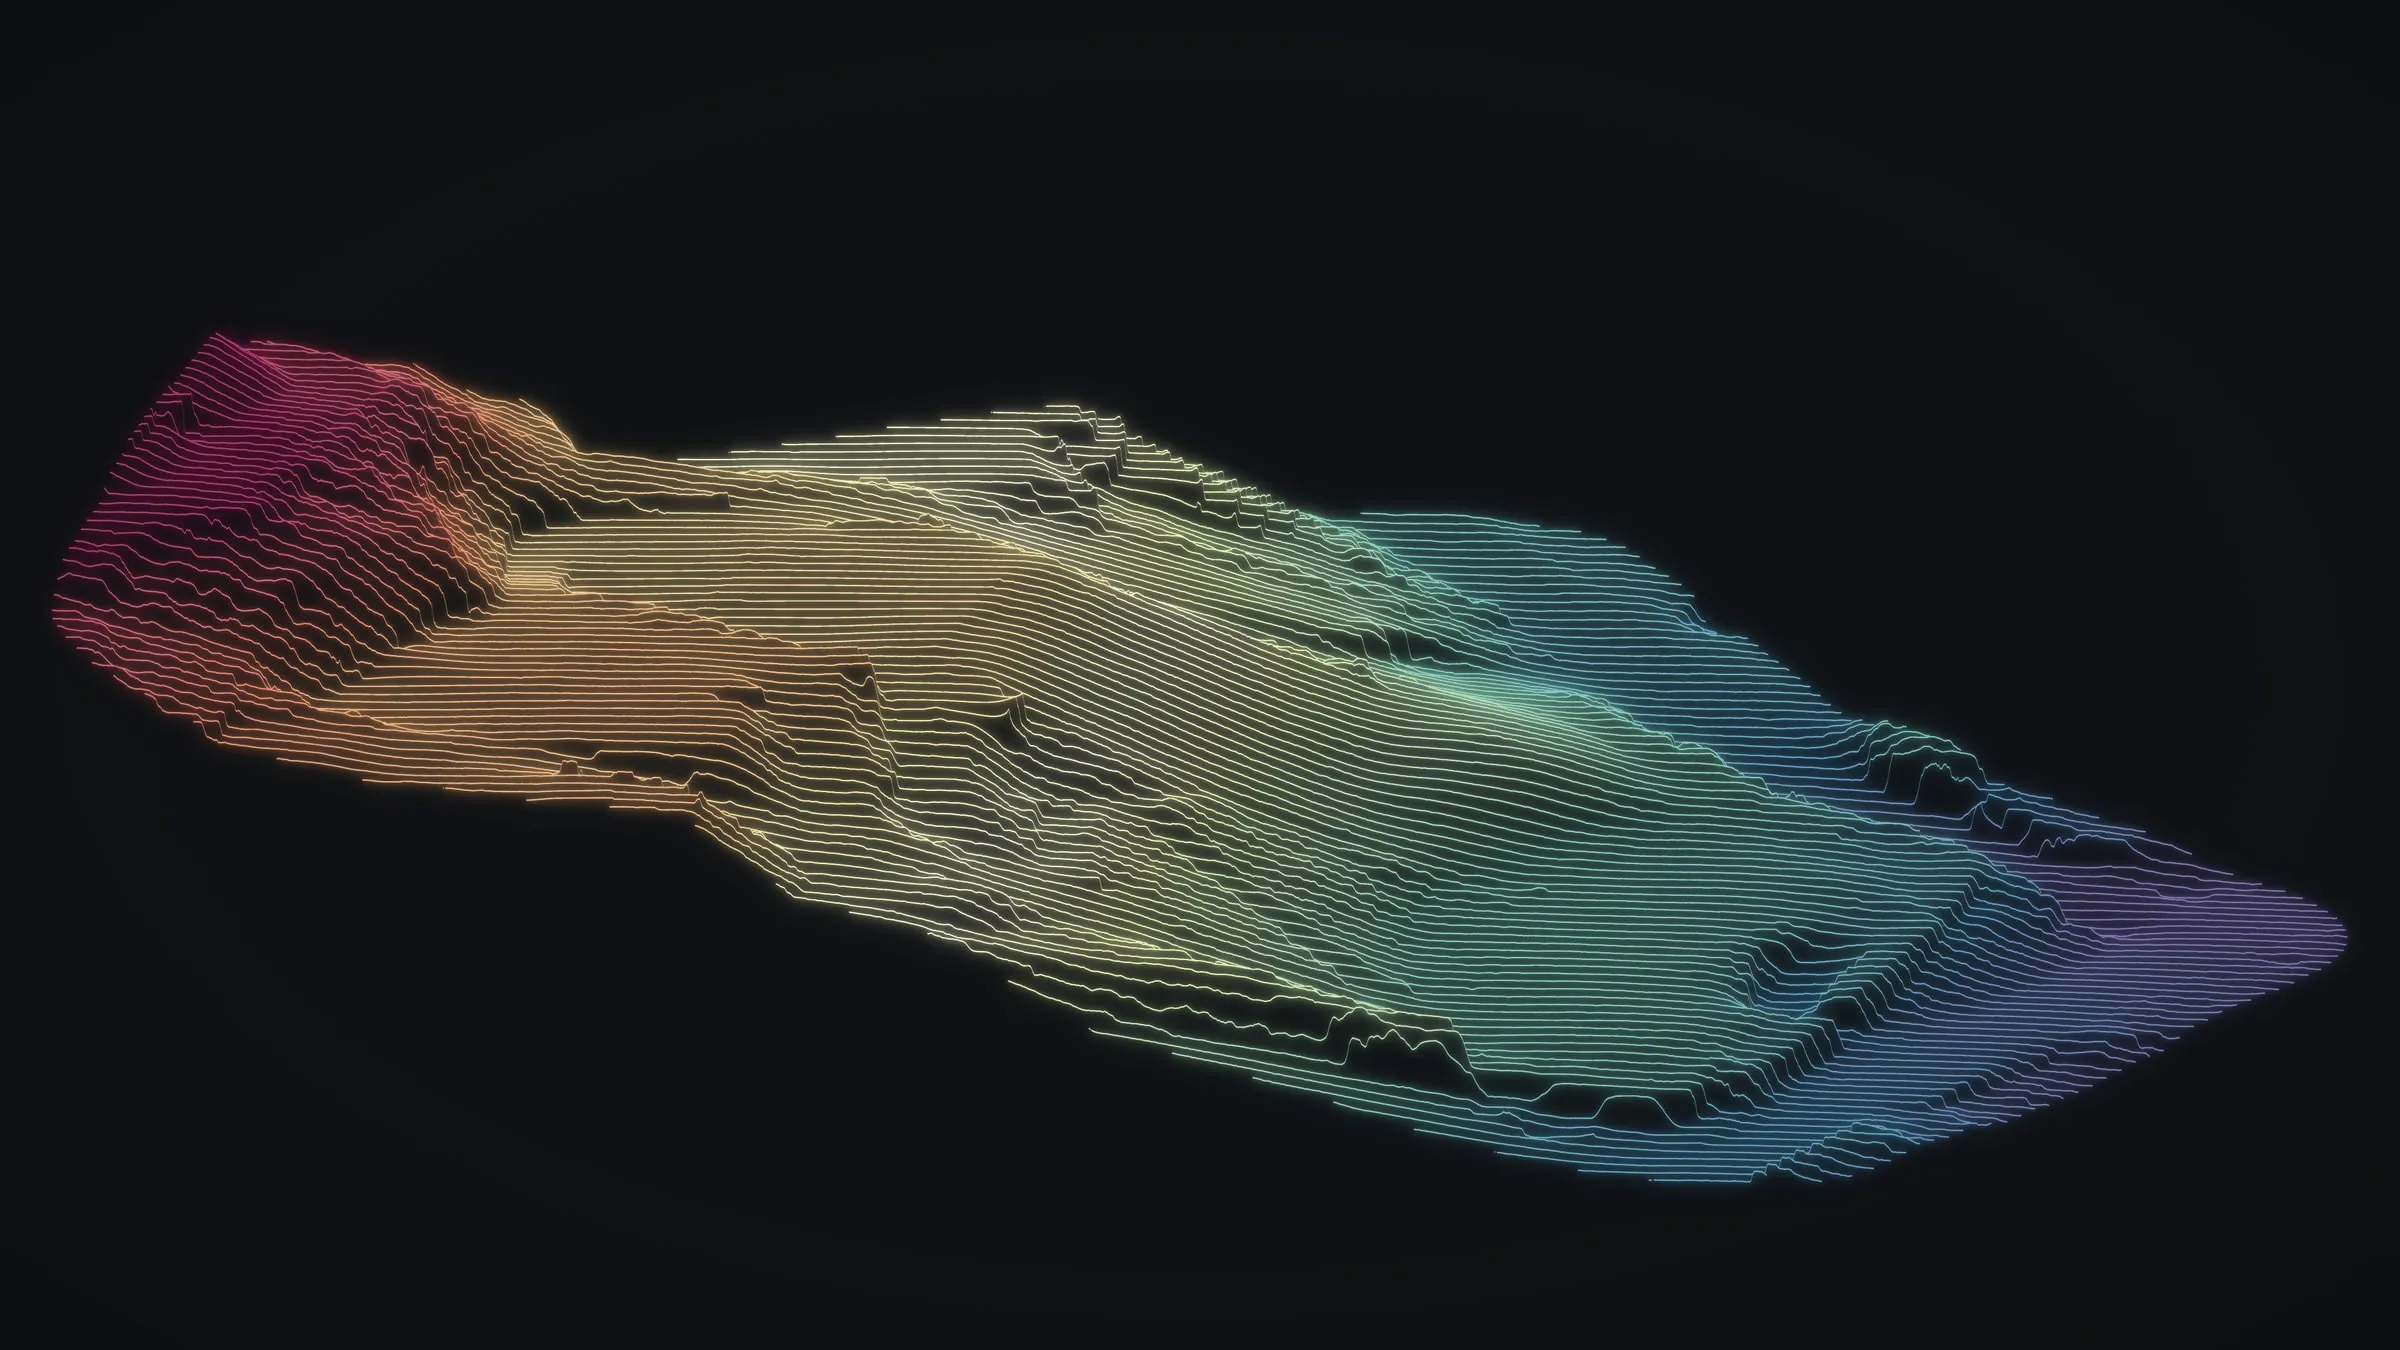 The slope as ridgelines, every terrace a step
 -
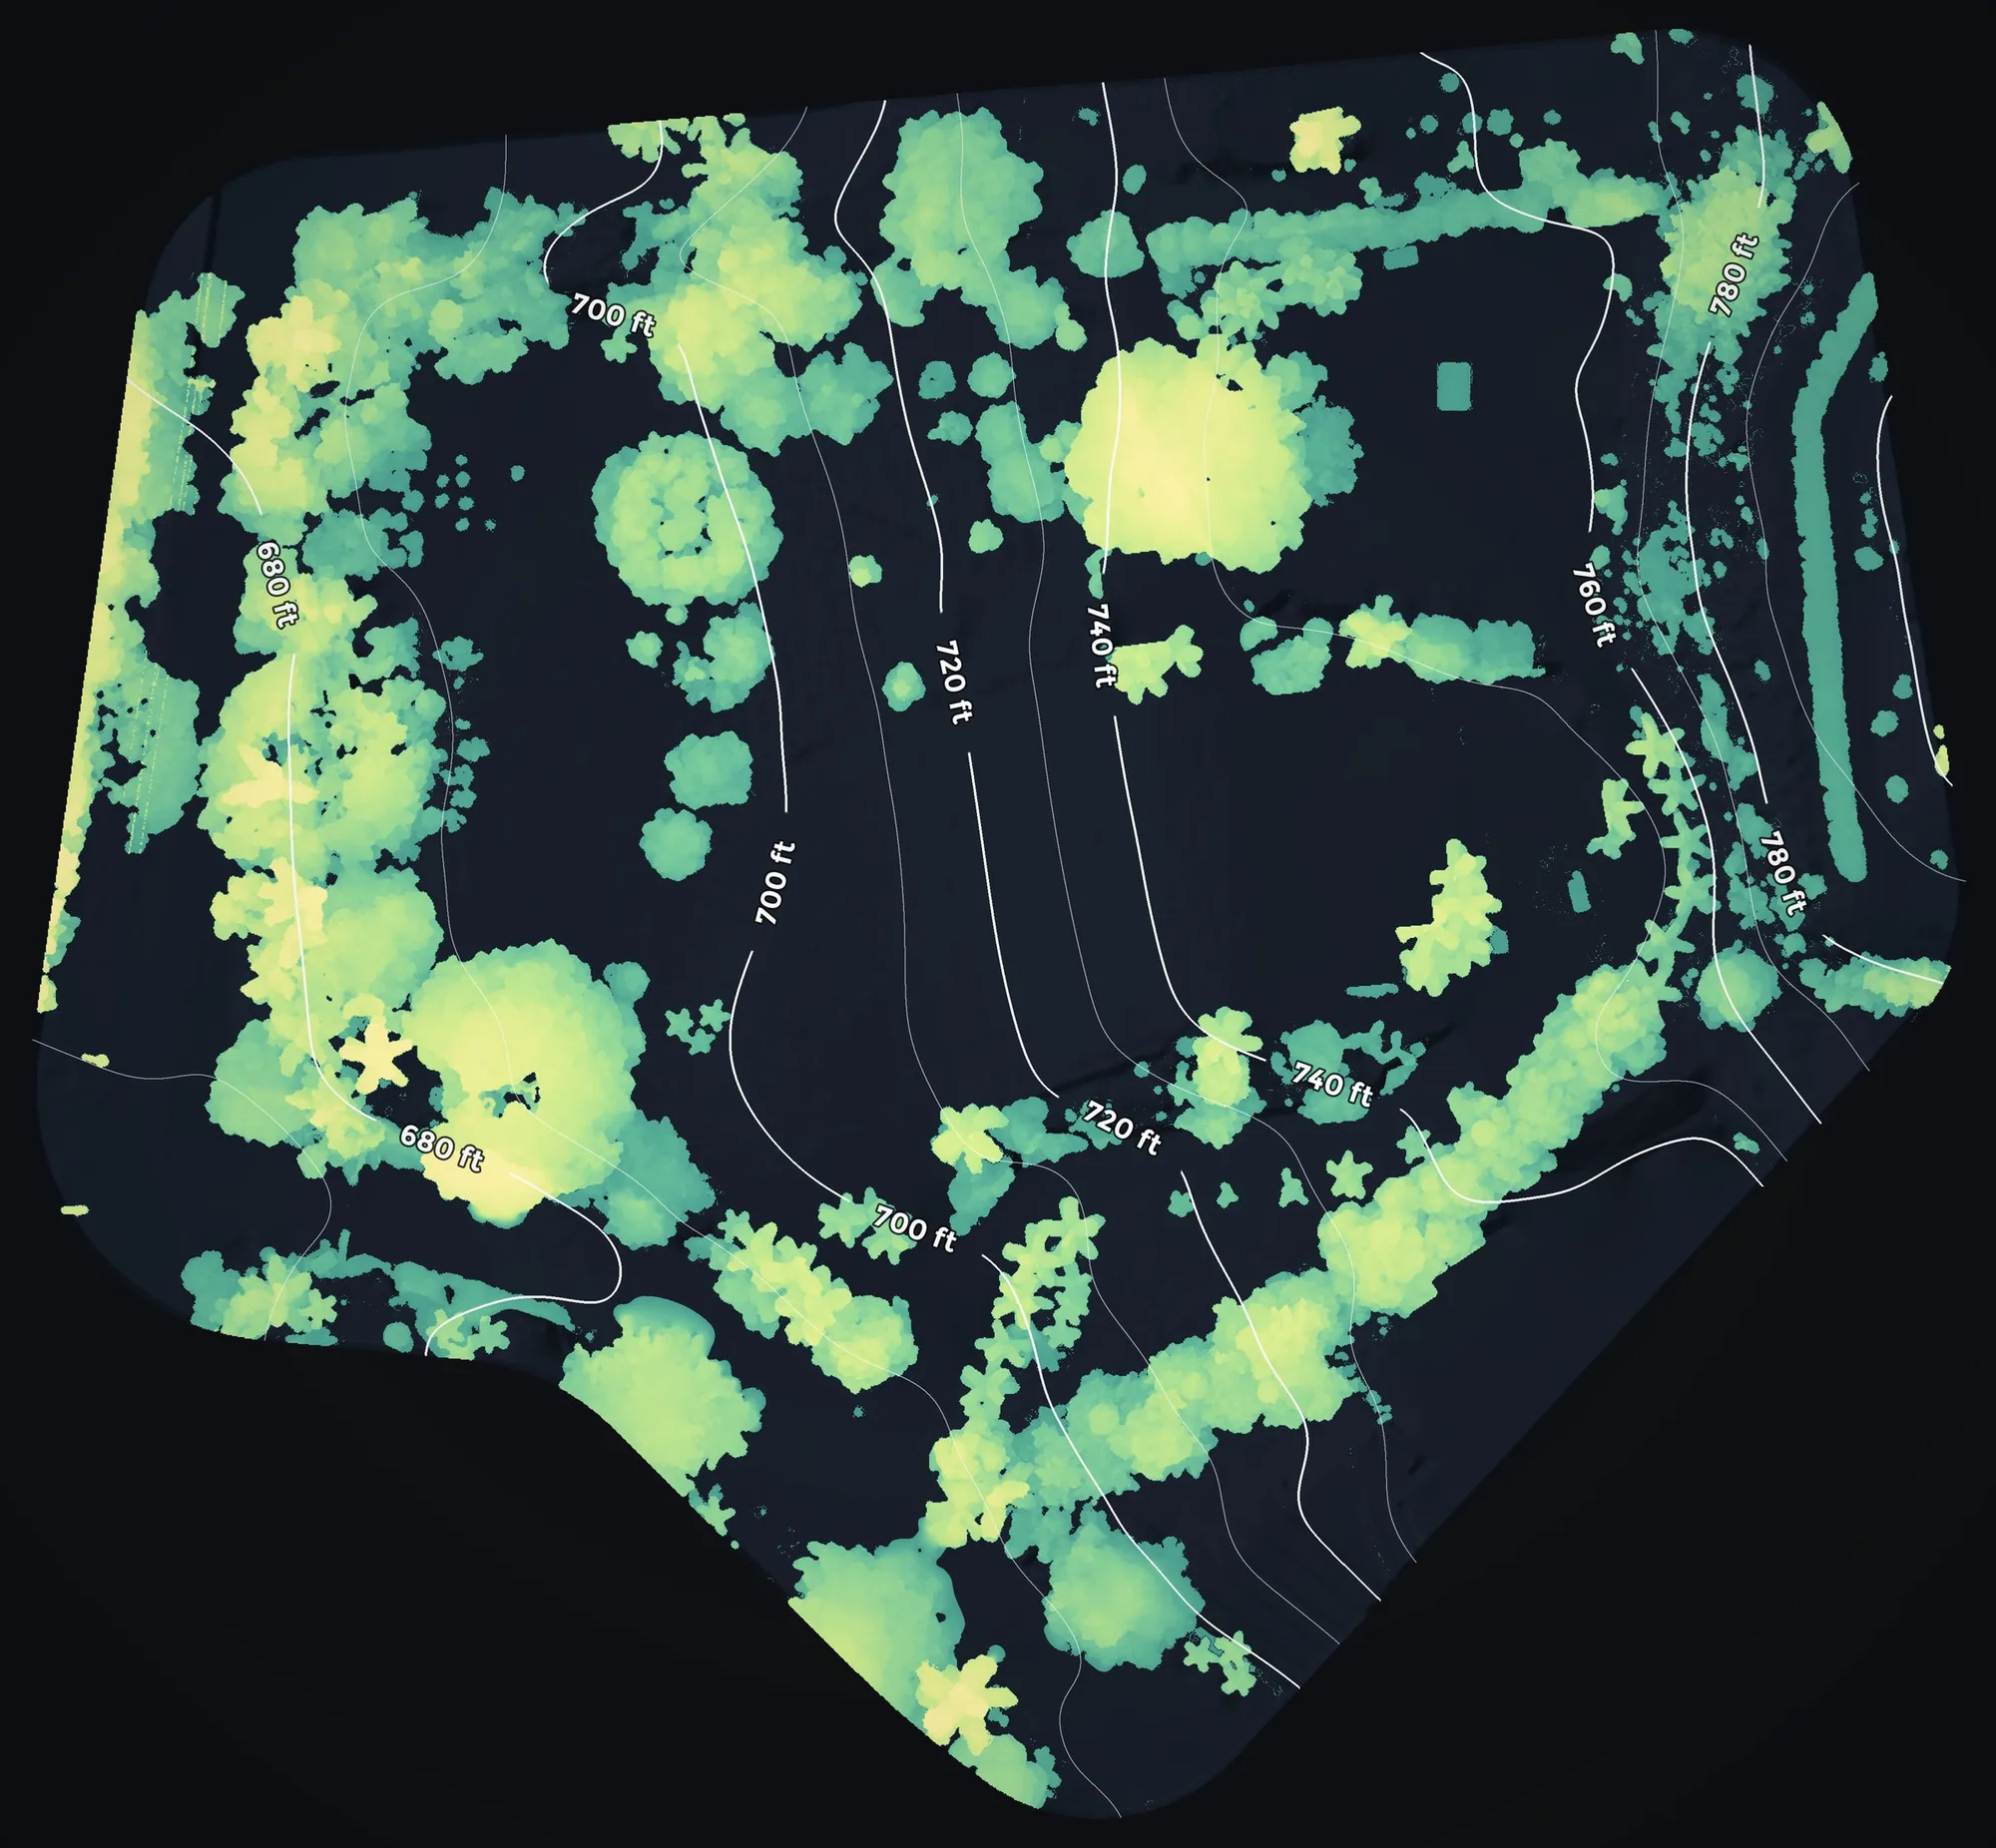
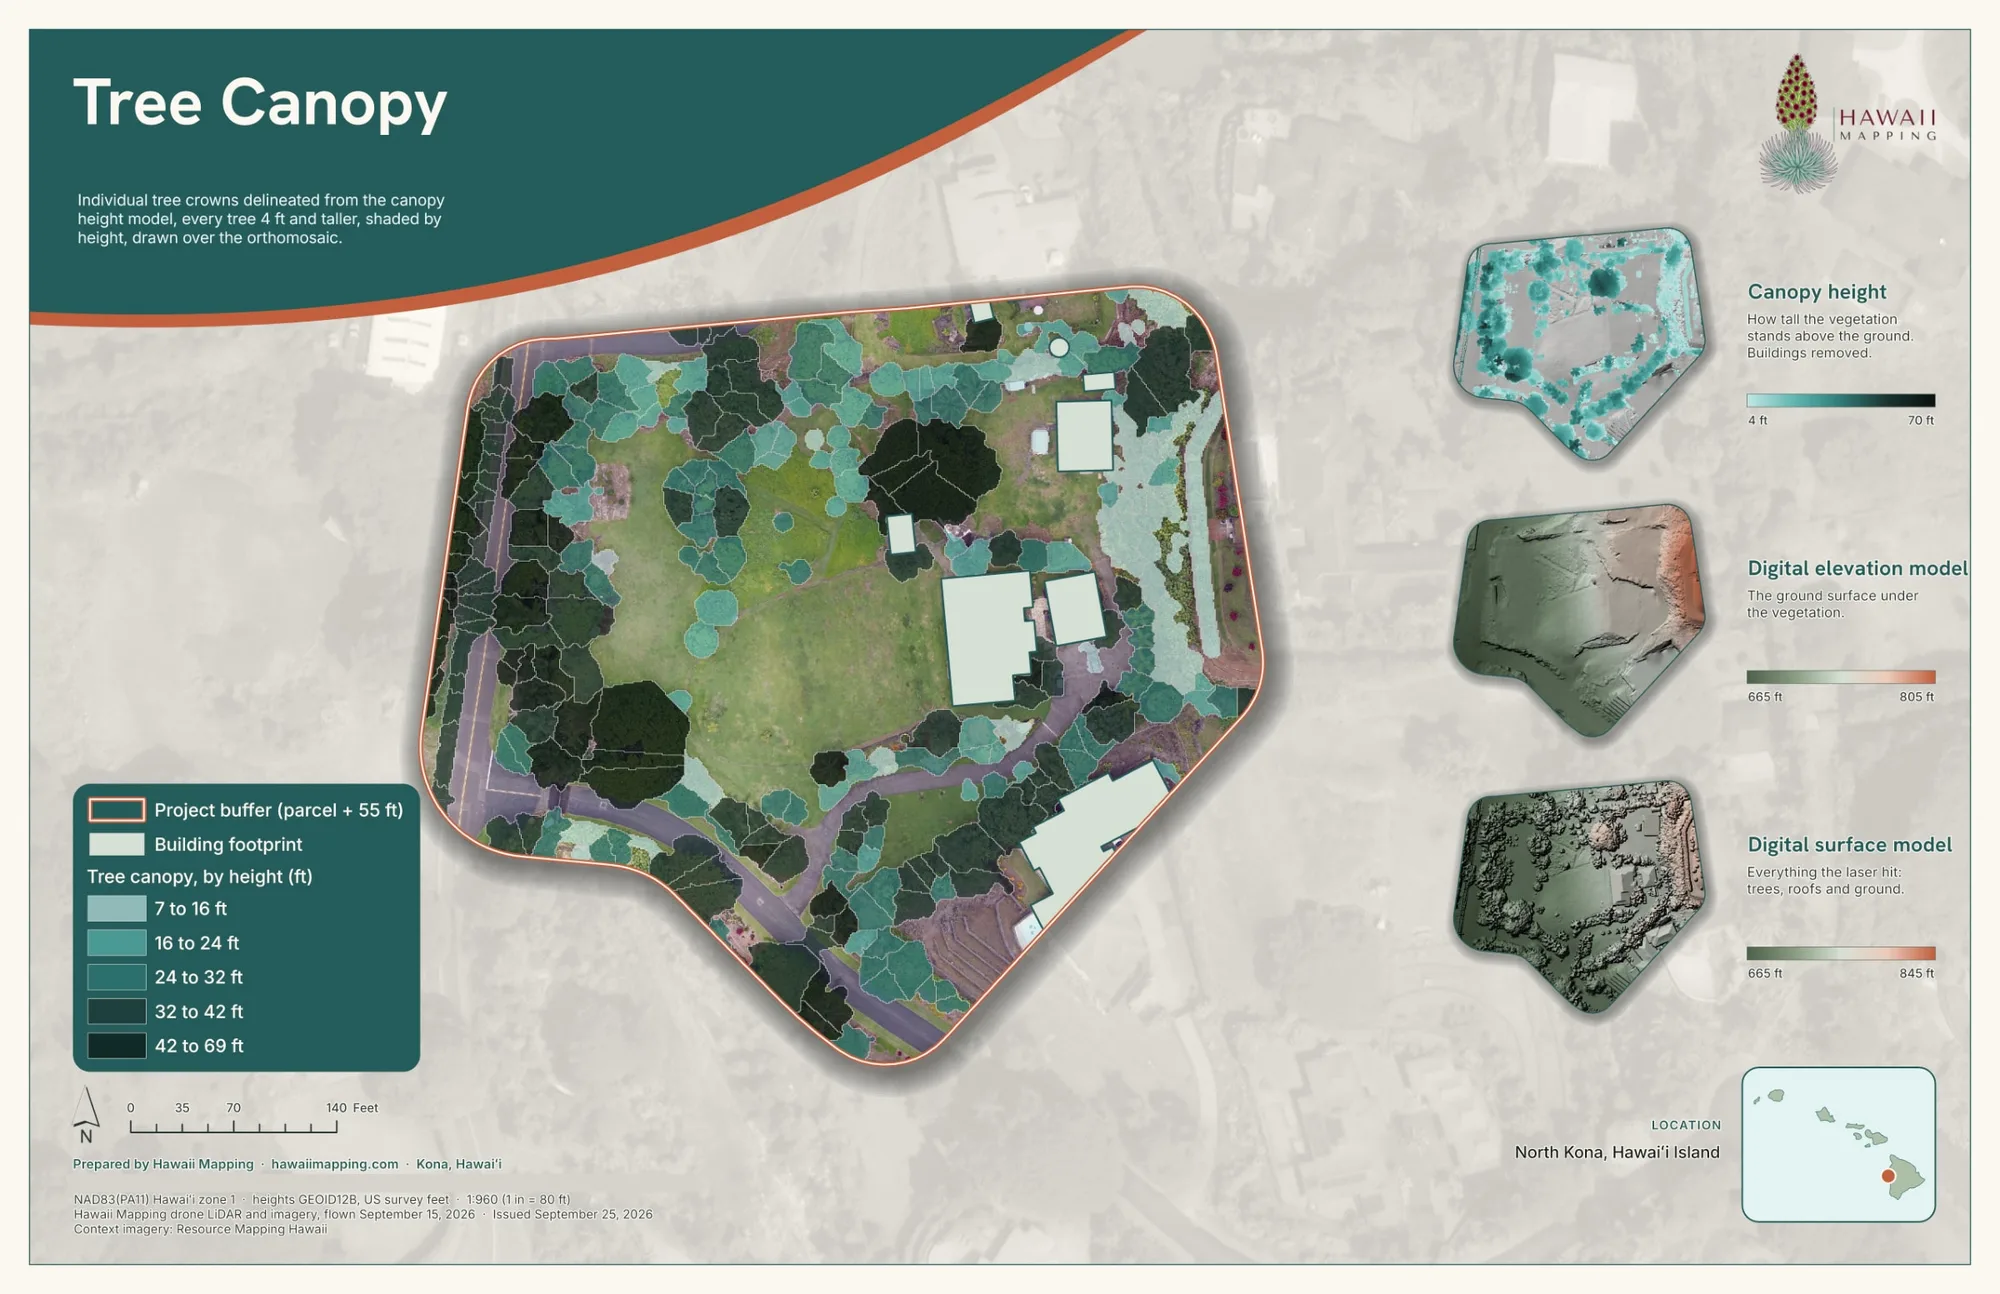
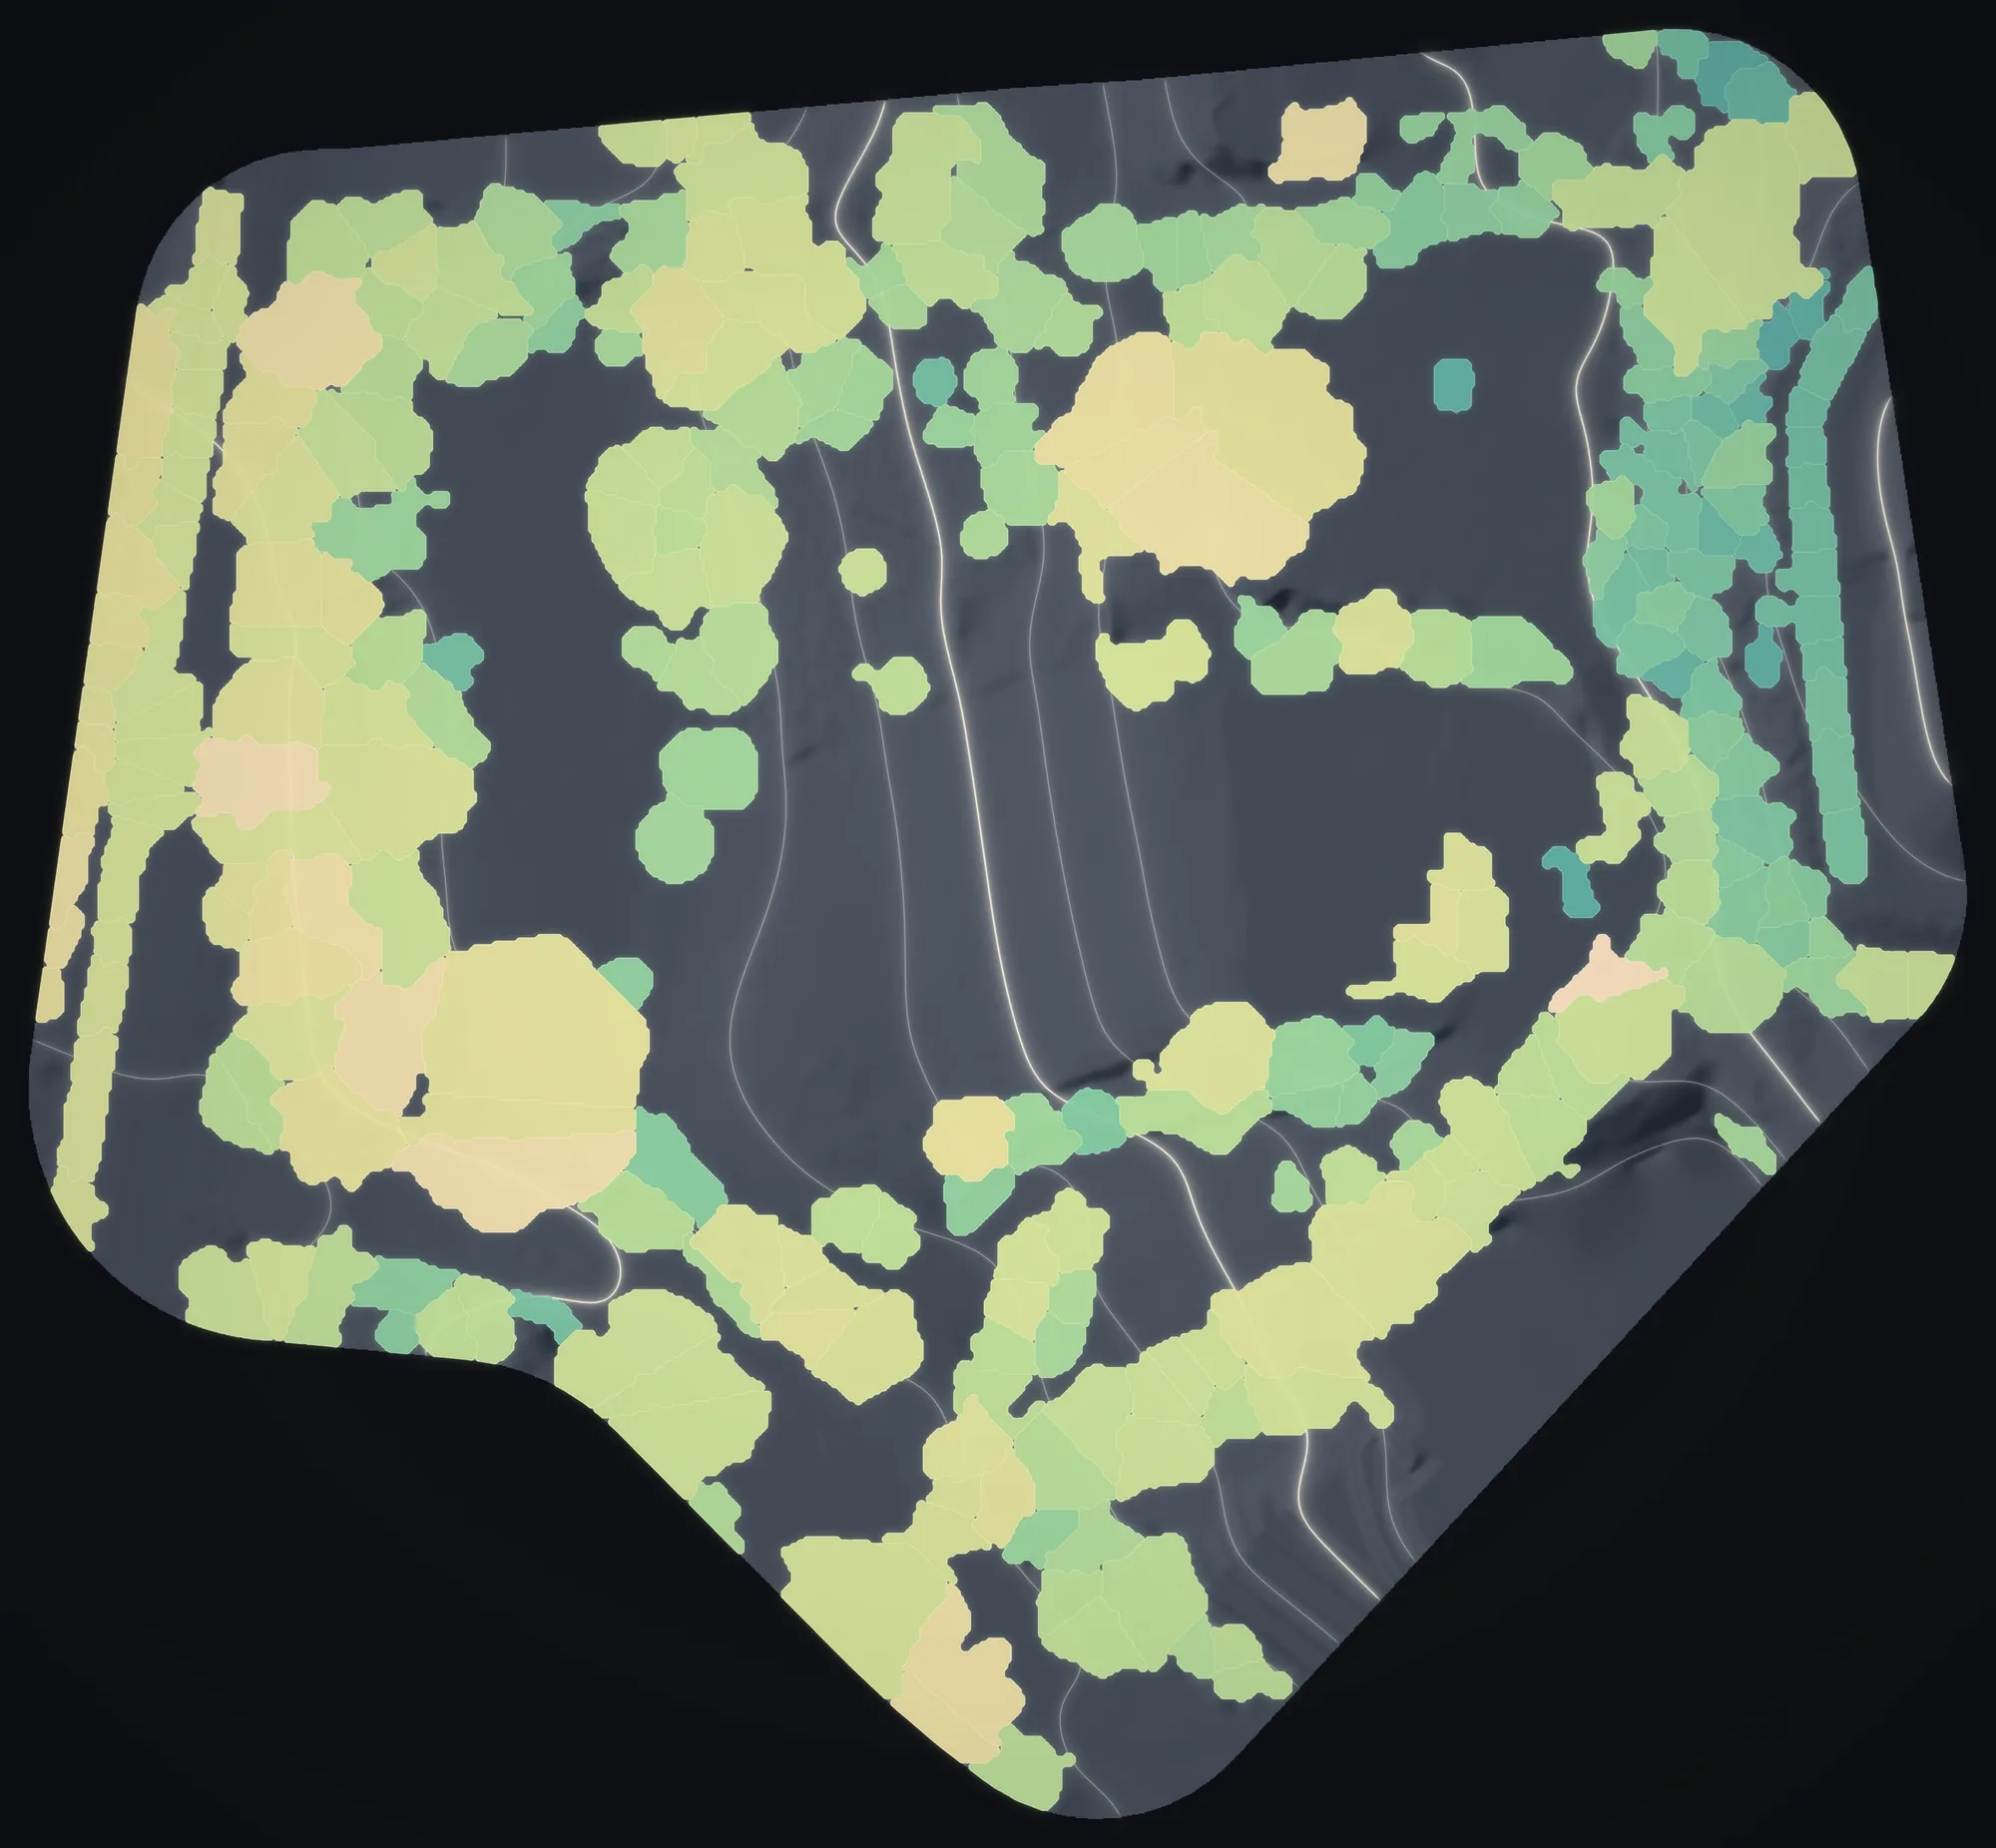
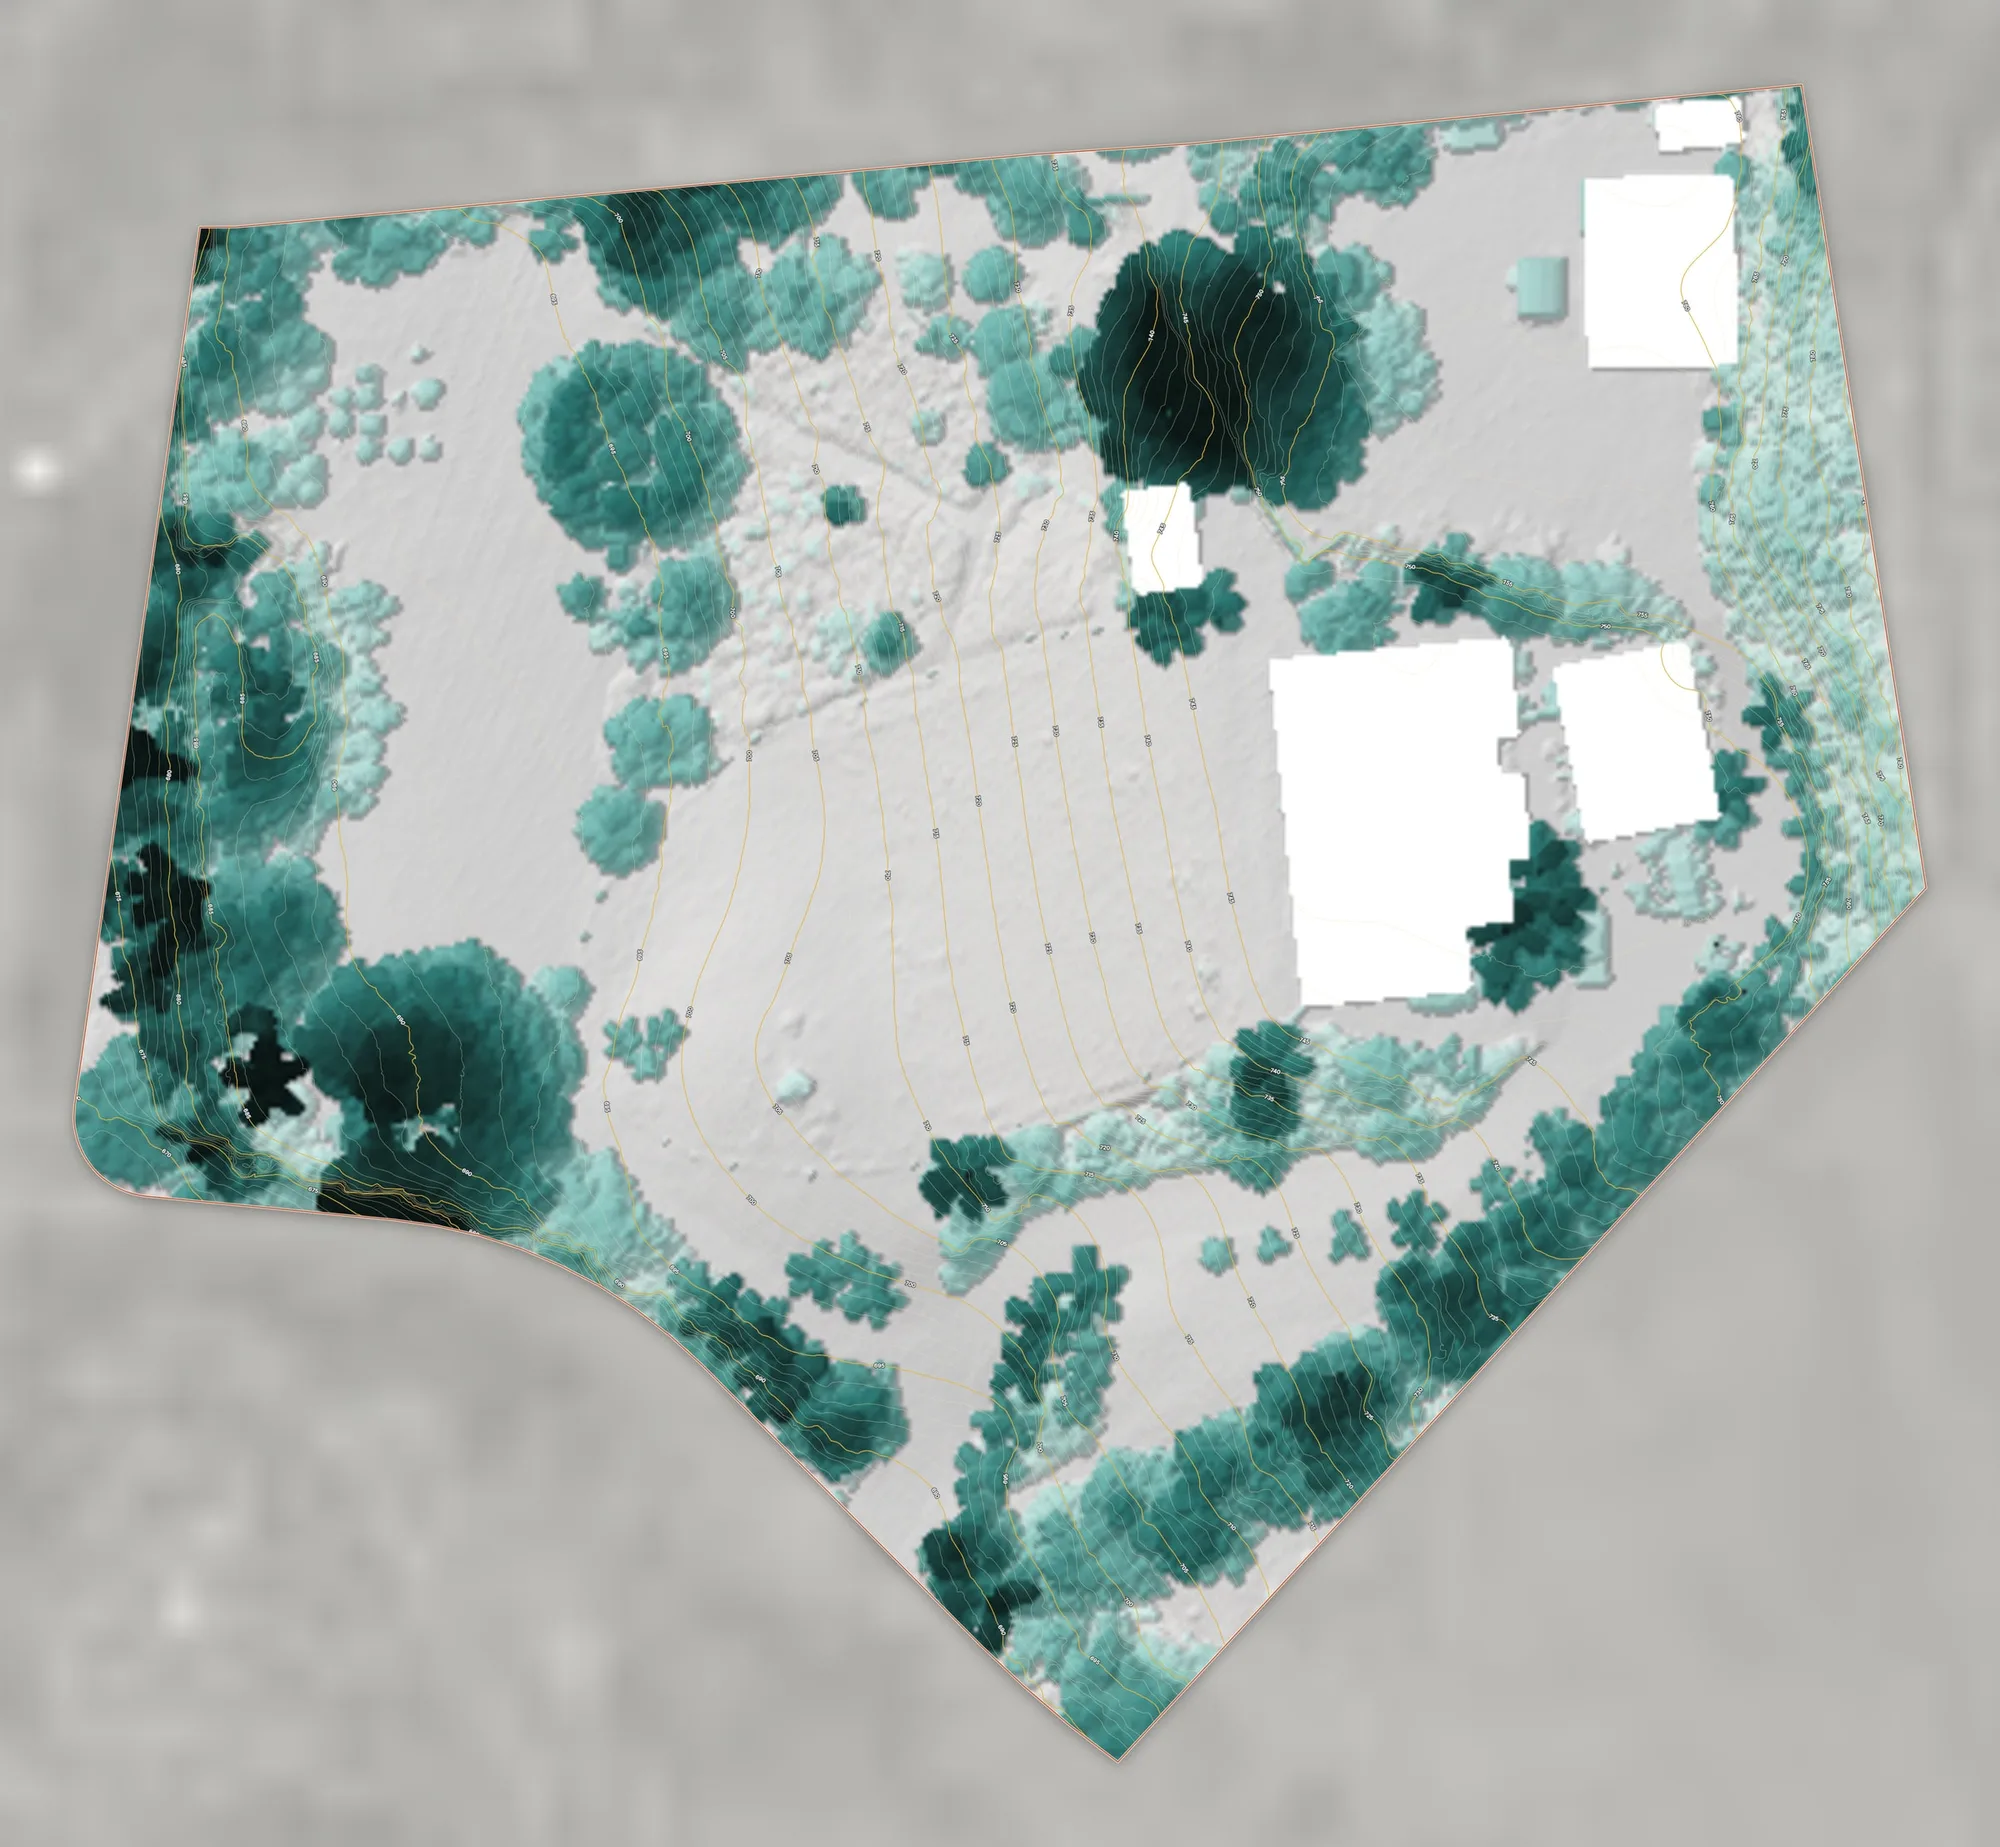
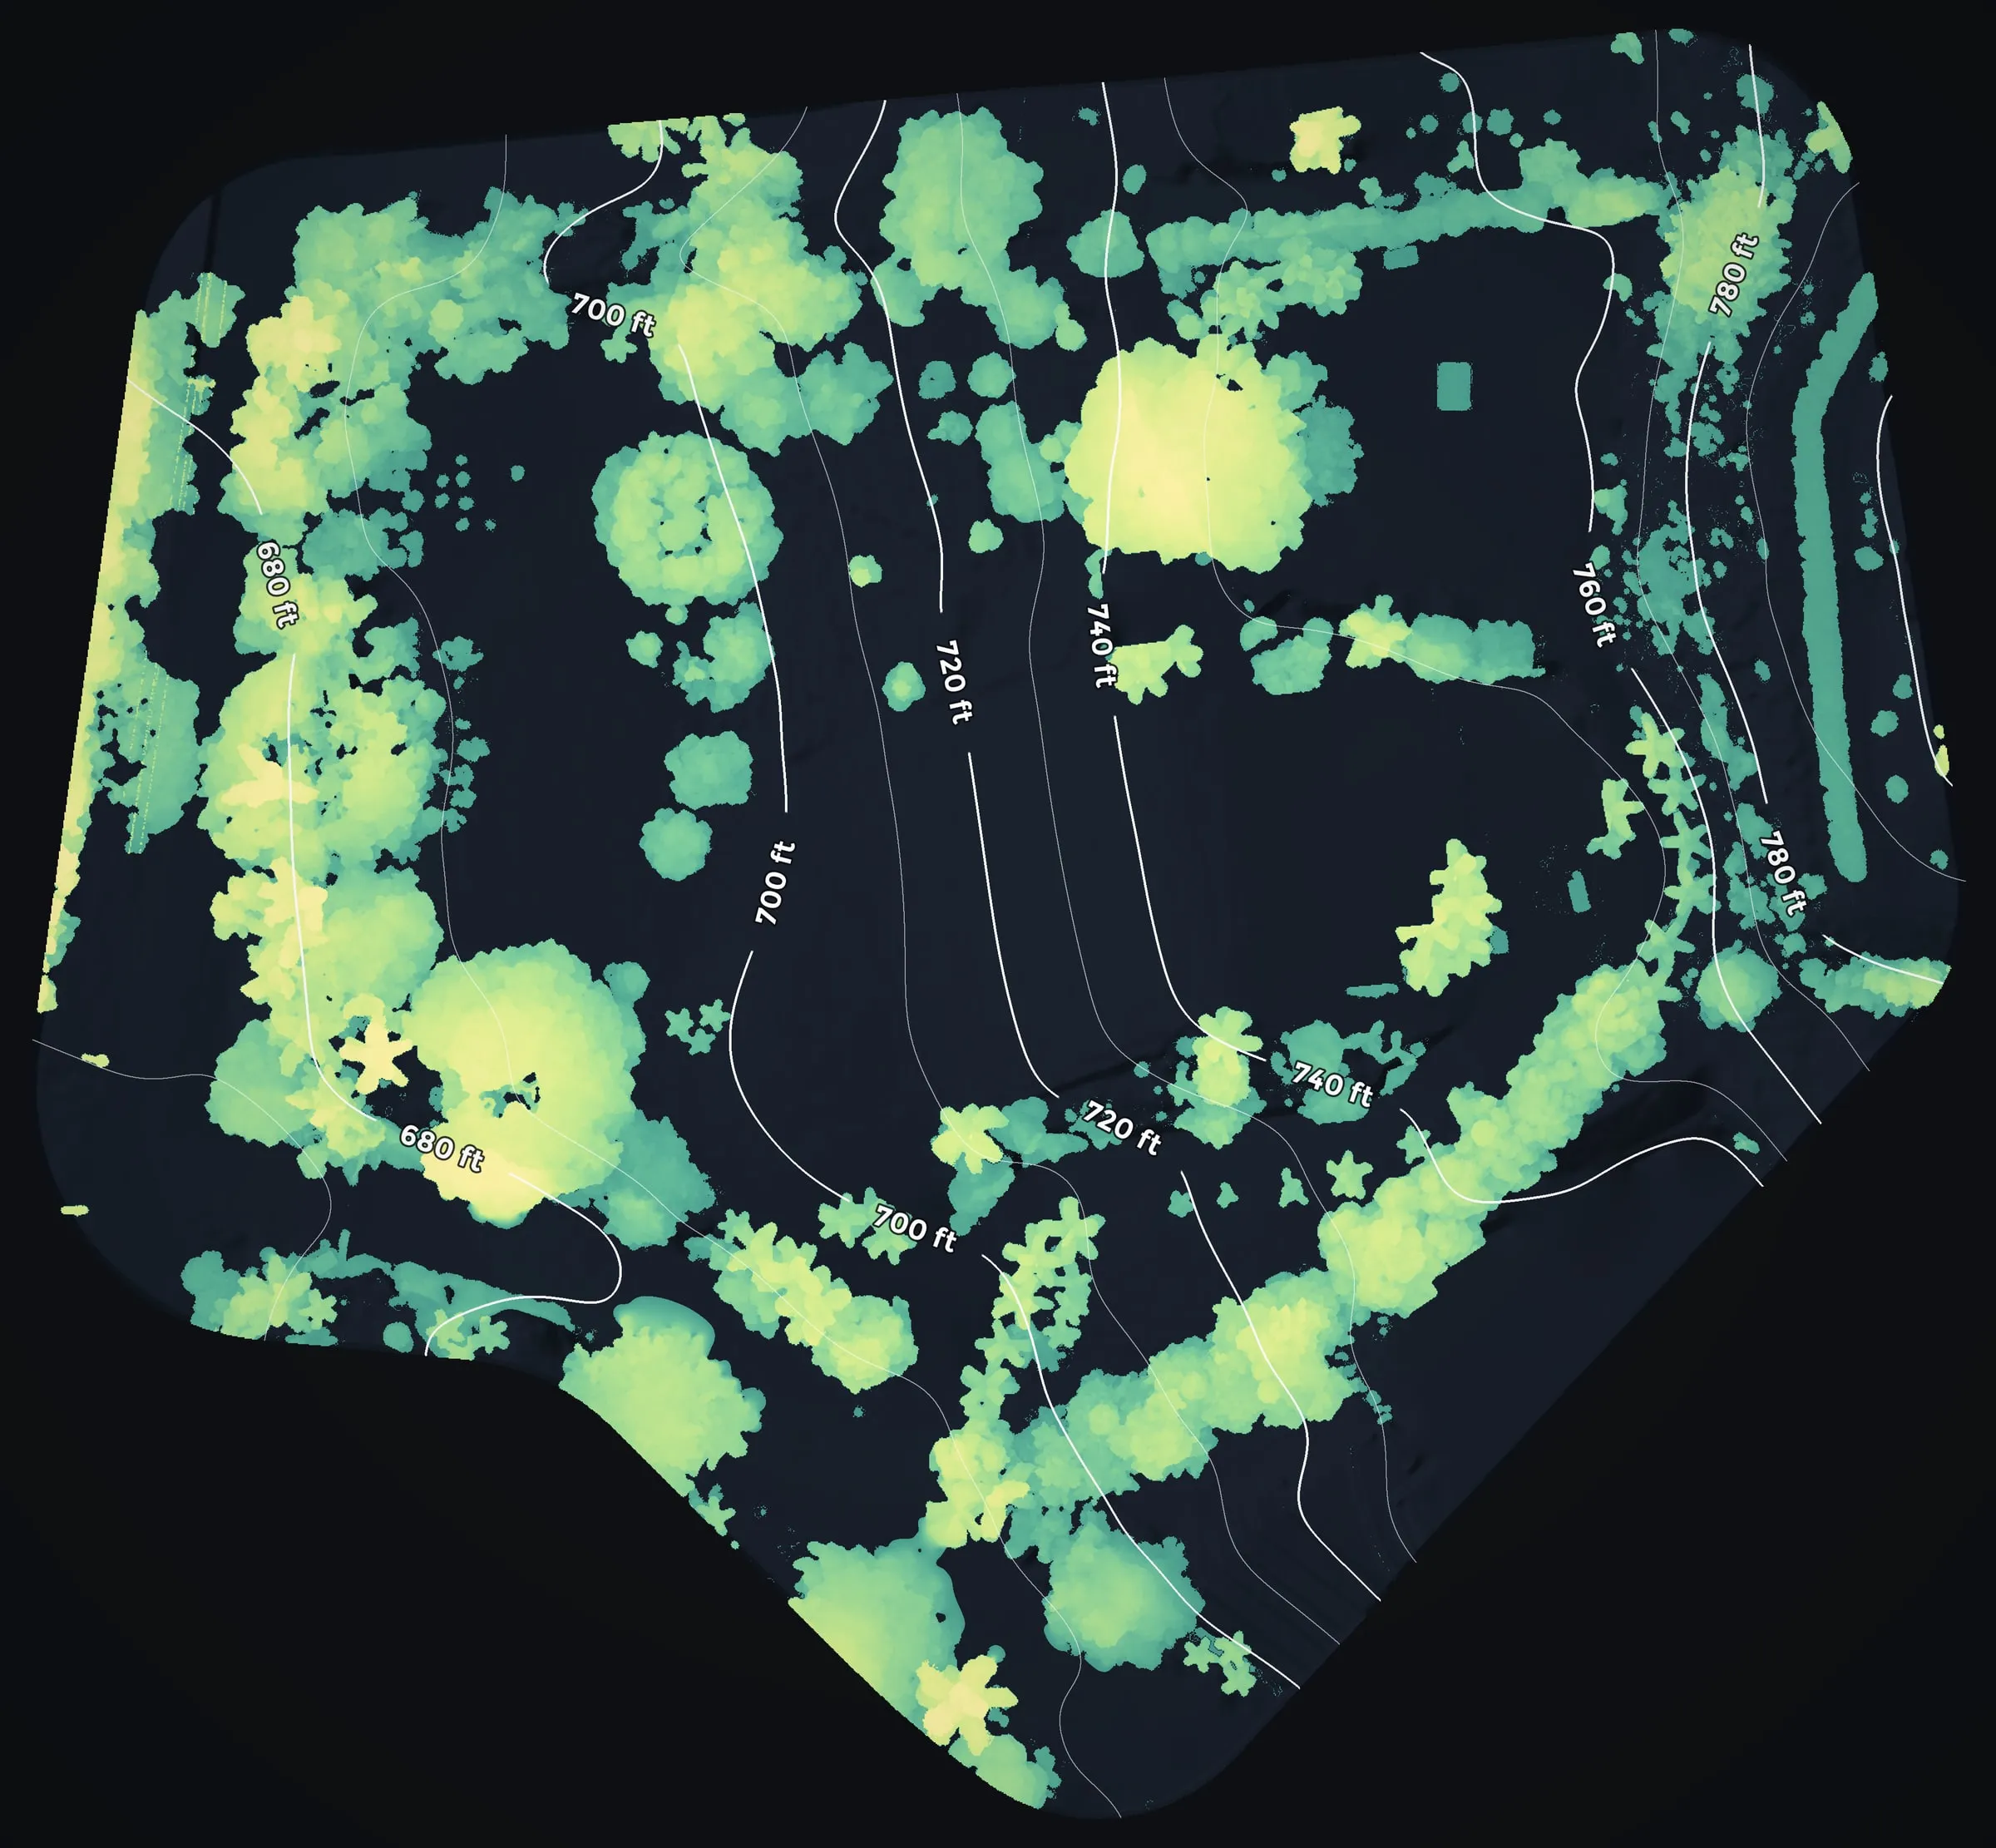 Canopy height, trees up to 69 ft
 -
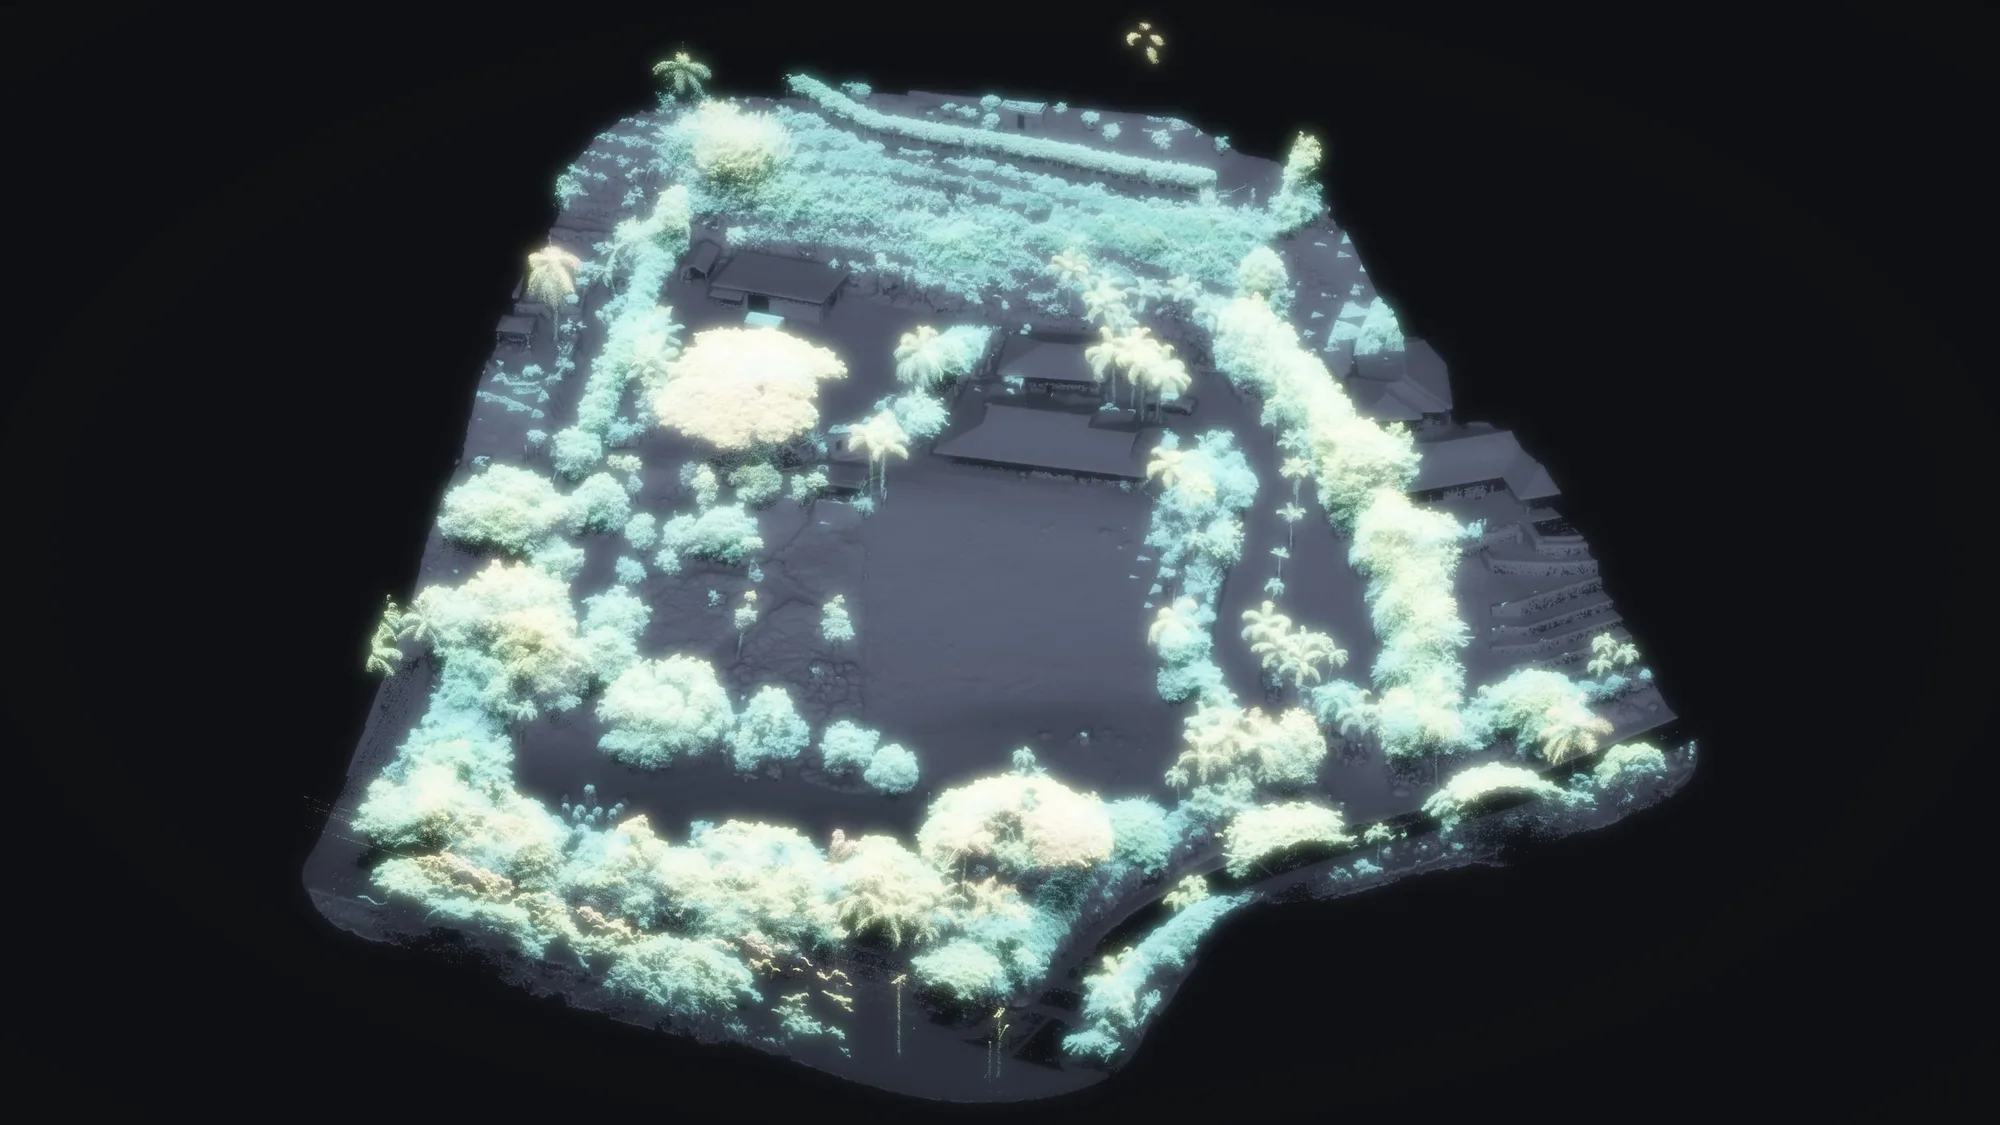
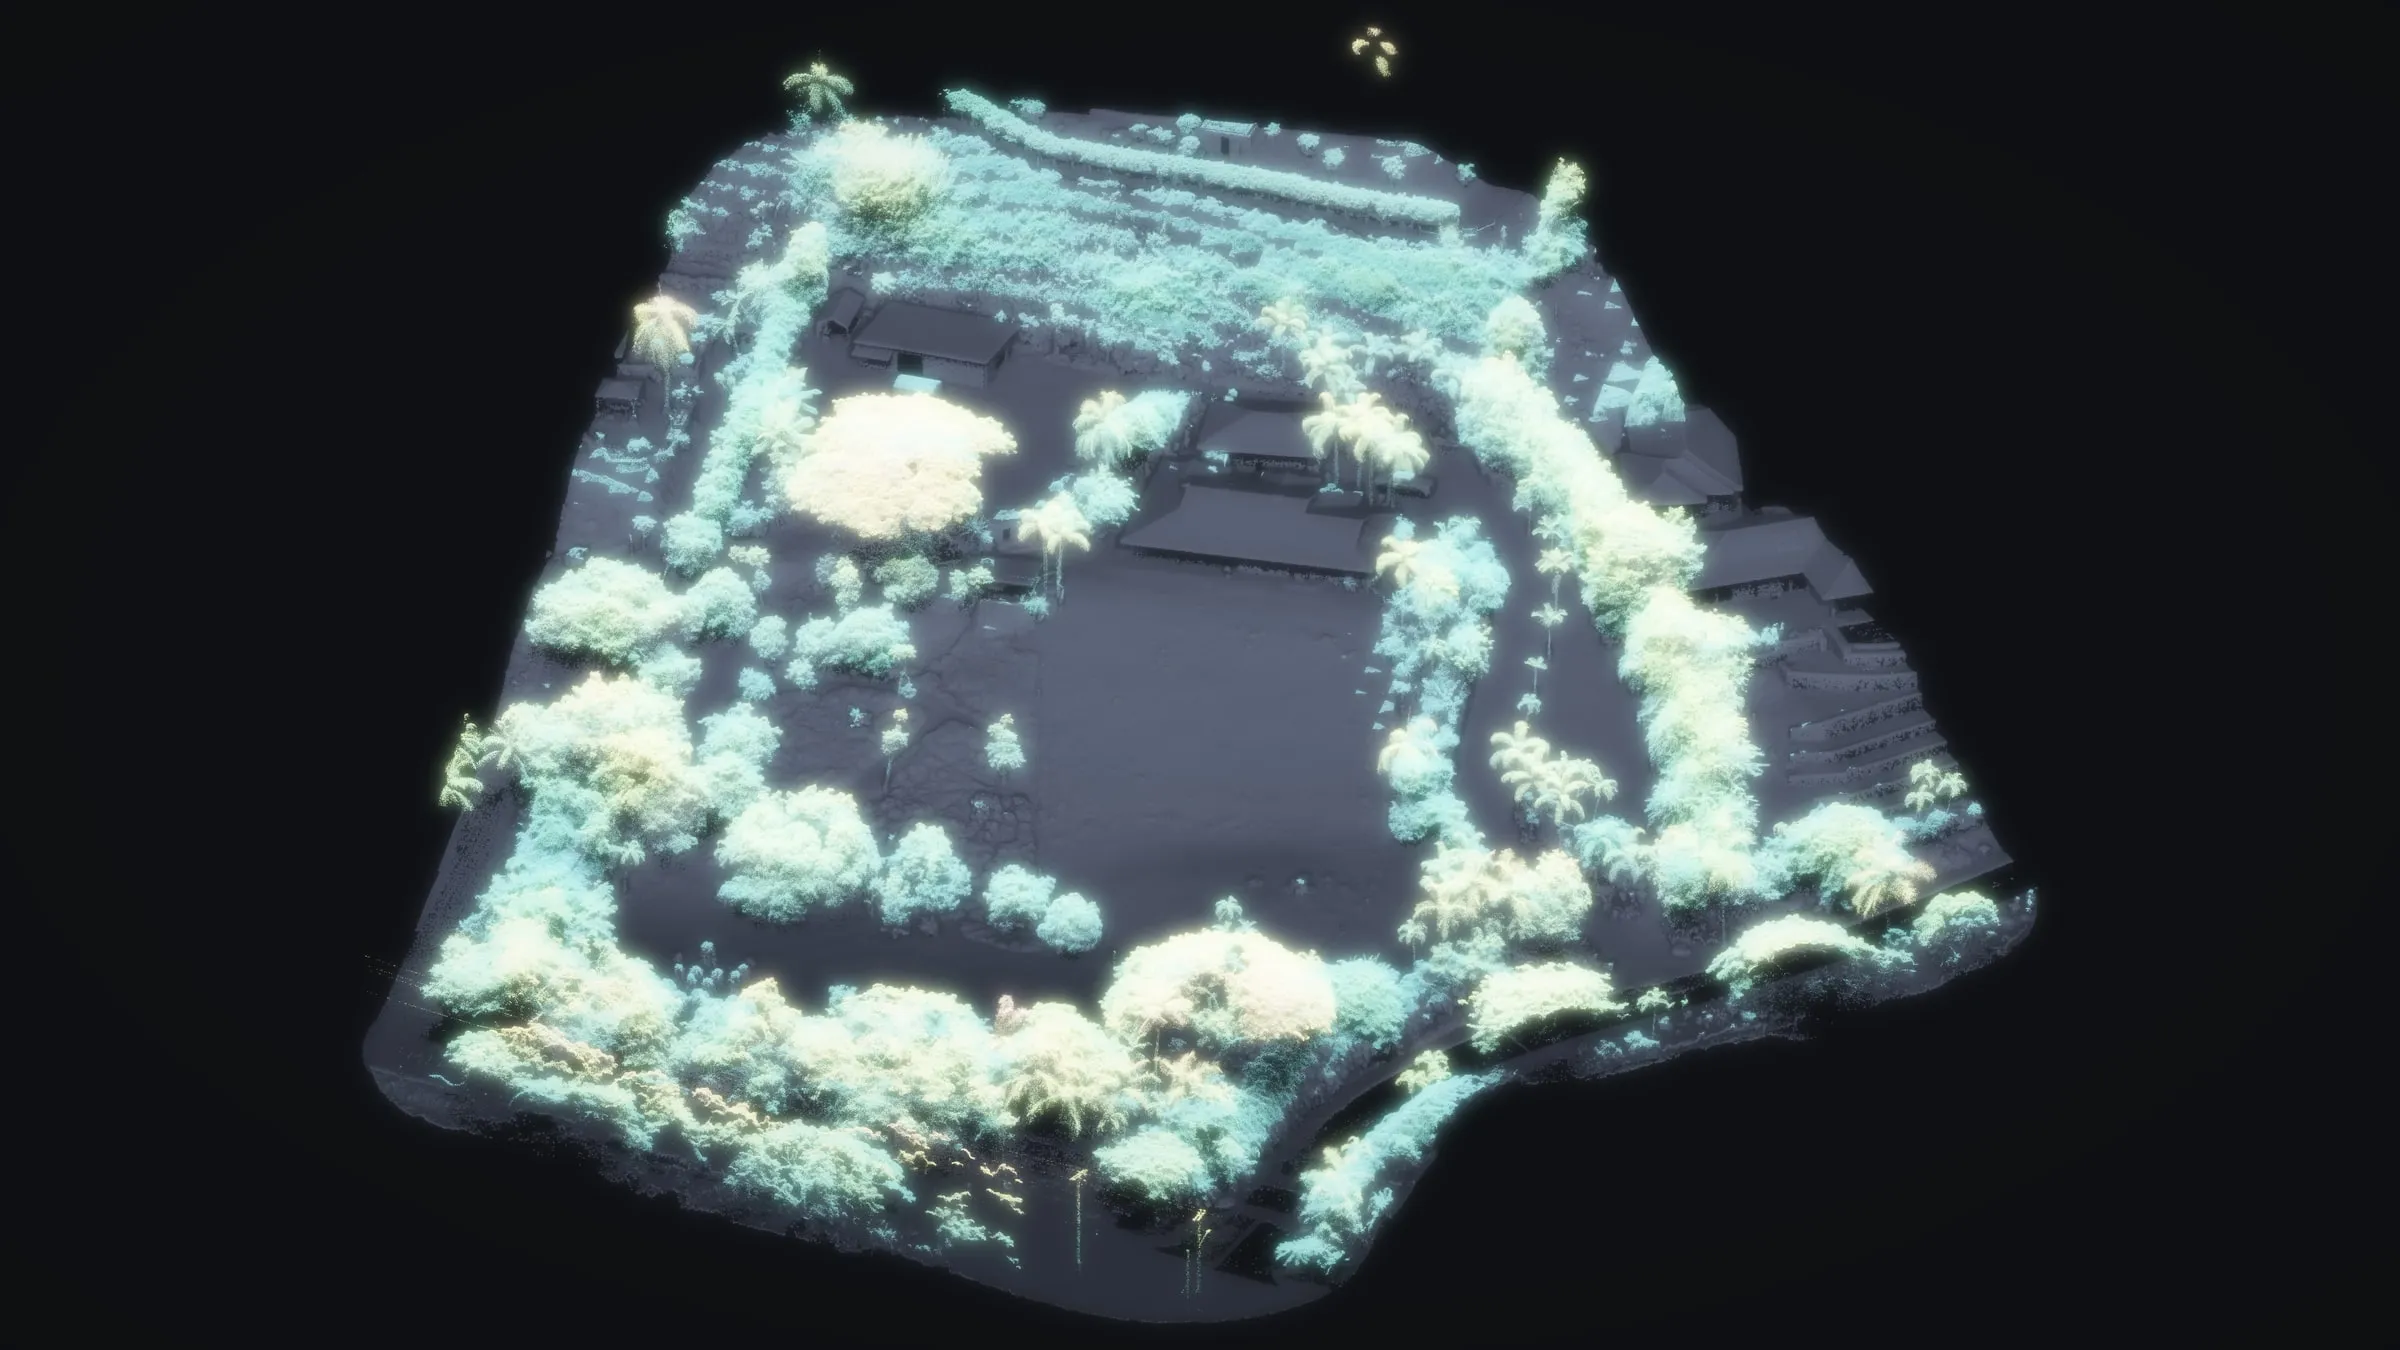 Everything standing, drawn as light
 -
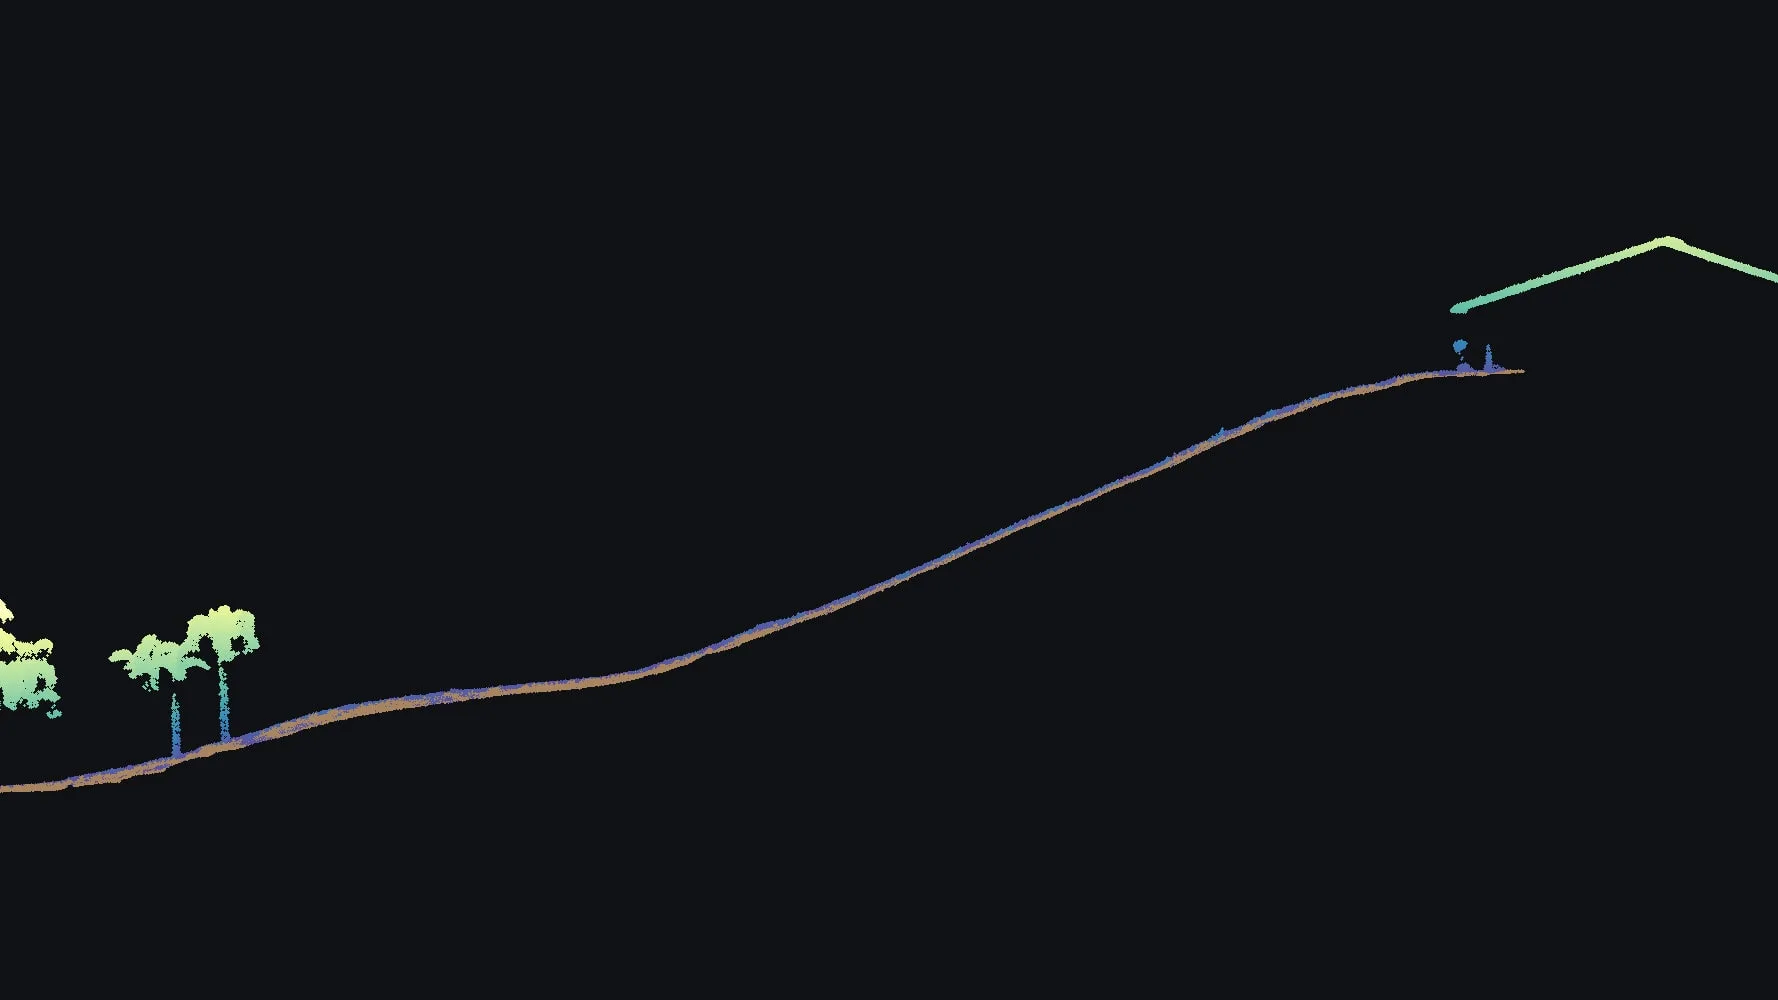
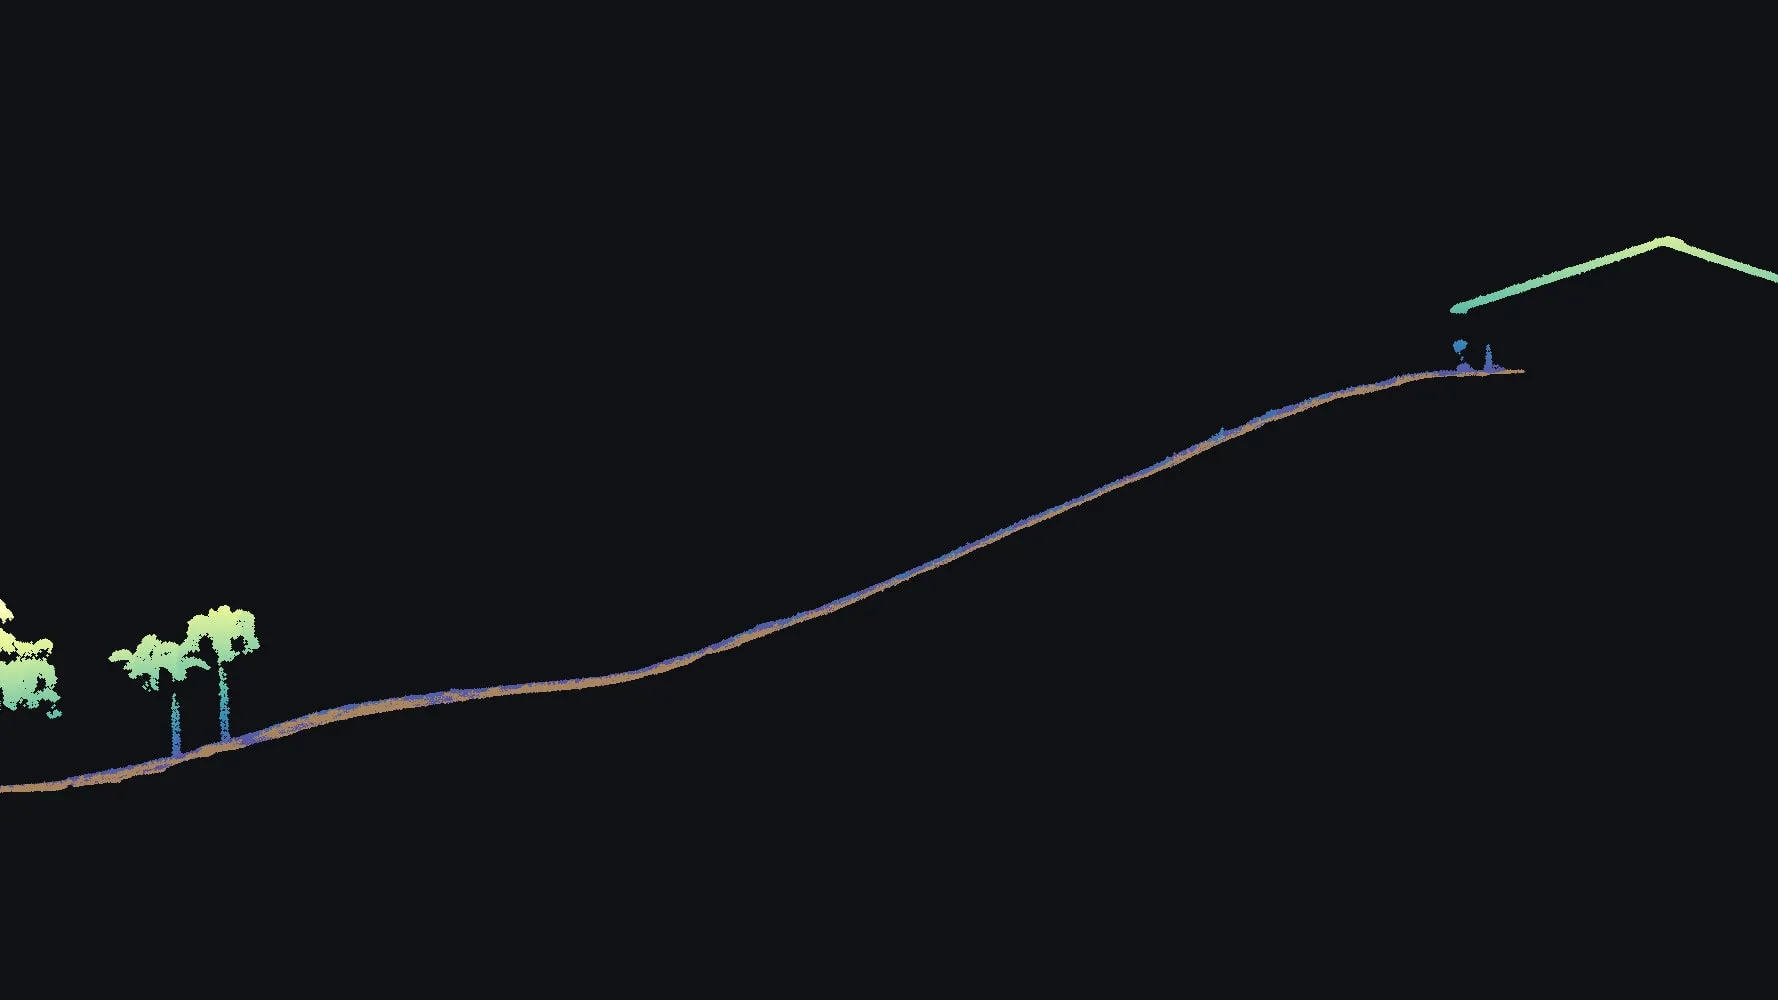 A 2 m slice up the hill at true scale
 -
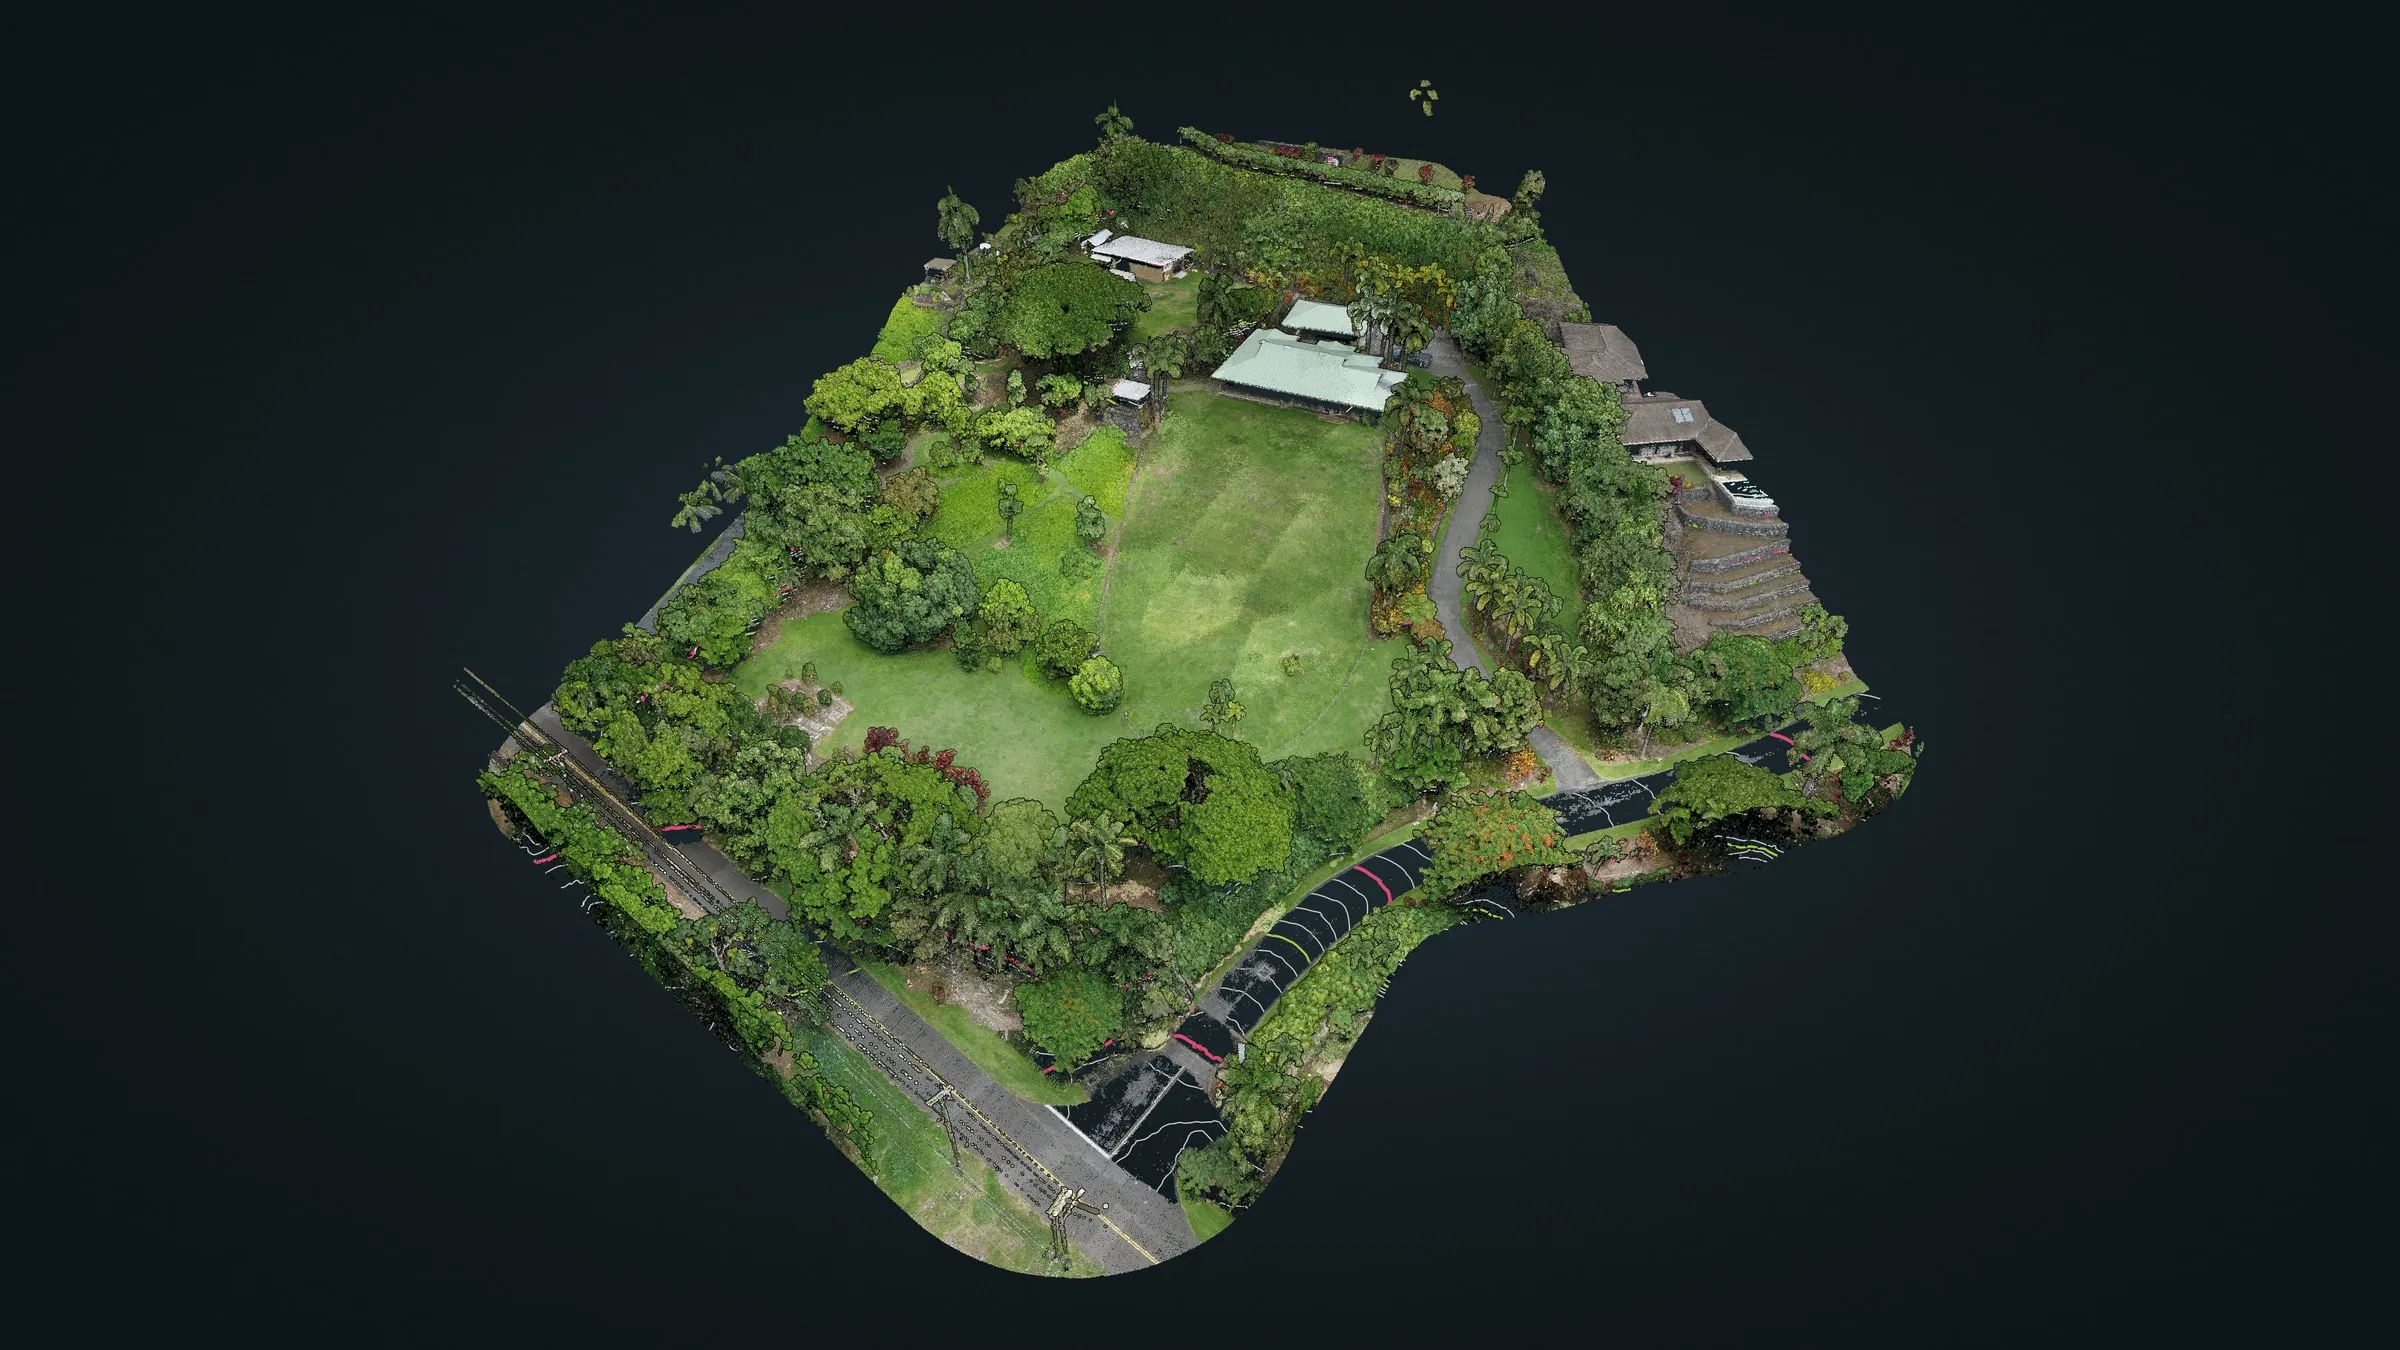 Contours drawn through the trees, in the viewer
 -
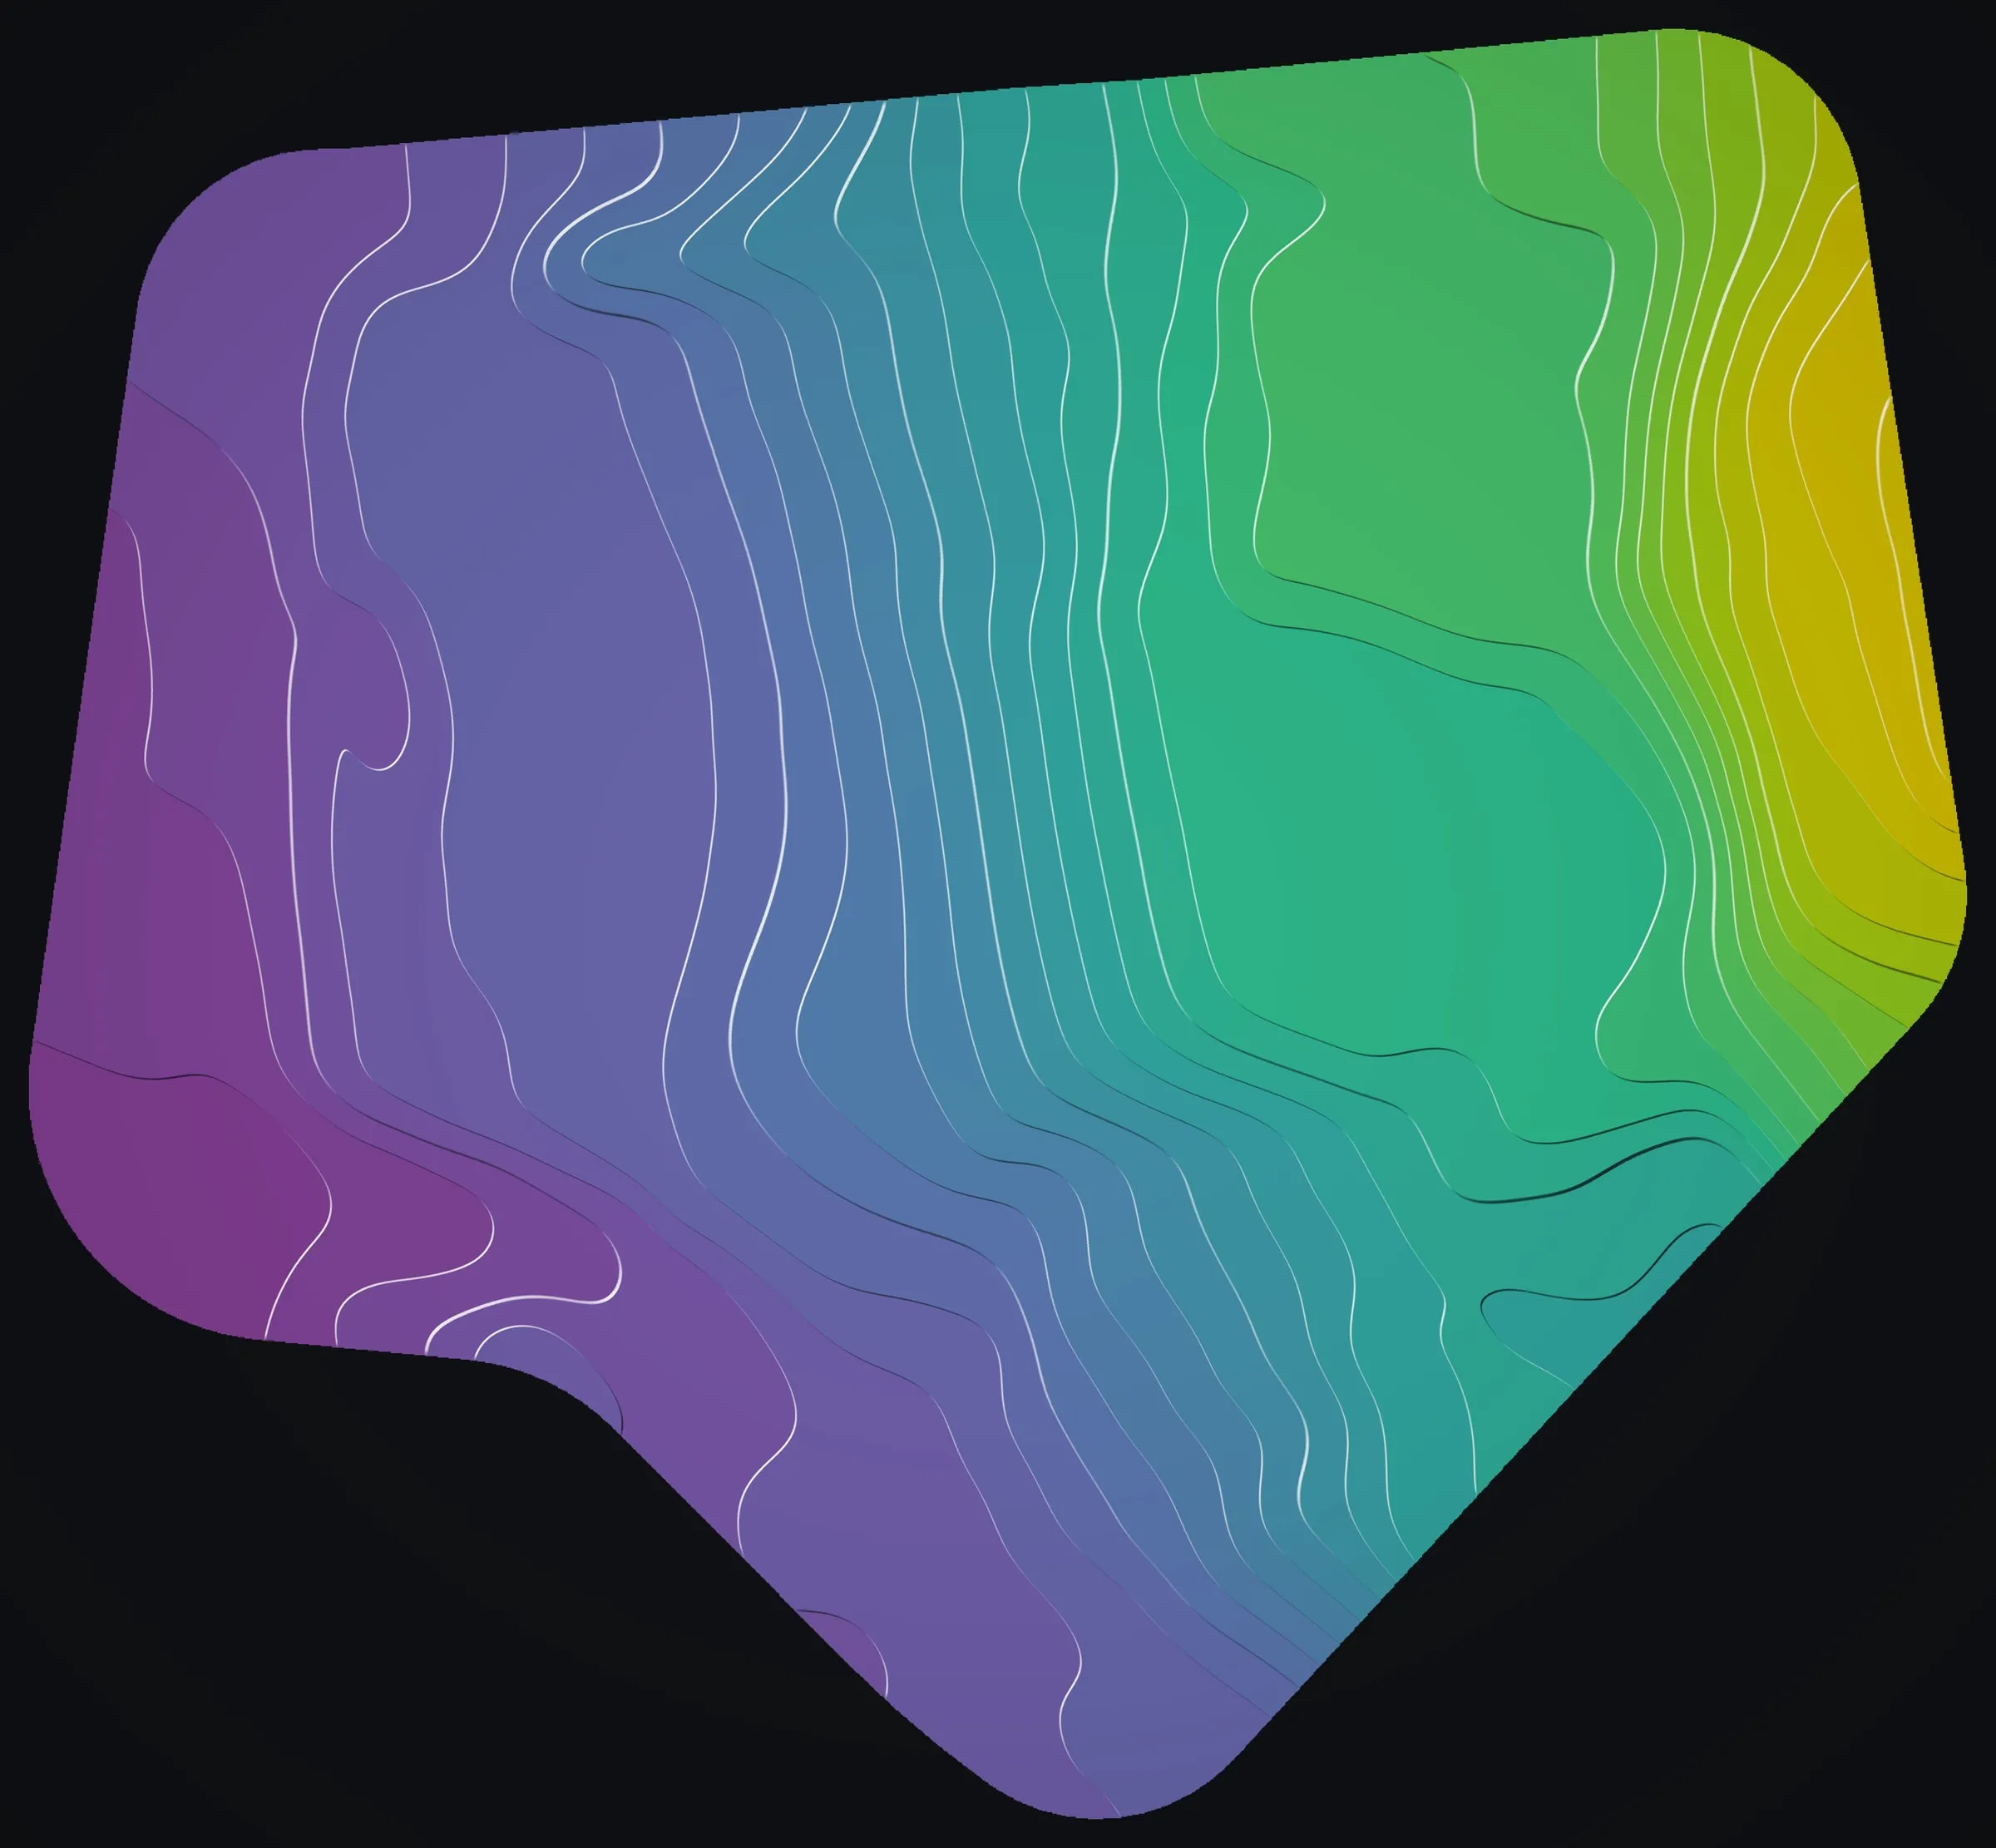 Illuminated contours every 5 ft
The question
The lot is about 3 acres of old terraces cut into the slope, with a house, a drive and a ring of big trees. The owner was weighing an extension, a new building, a pool and a septic field, and each of those asks the ground the same thing first: how steep is it here, and where does the water go. A county map and a phone photo cannot answer that on a hillside where the terraces hide under grass and the edges hide under trees.
One flight
On September 15, 2026 we flew the parcel and a 55 ft margin around it with drone LiDAR and a camera together, 5.1 acres in all, with a GNSS base station logging over a mark on the lot. The laser recorded 57,507,170 points inside the mapped area, about 2,800 on every square meter, enough to hold each terrace edge, each step in the drive and each tree crown.
What the landowner received
- A classified point cloud: ground, vegetation and buildings
- Bare earth, surface and canopy height rasters on a 10 cm grid, heights in feet
- Contours every foot, heavier every 5 ft, drawn around the buildings rather than through them
- A slope map, the building footprints, 303 tree crowns and 403 treetops
- An orthomosaic at 1.5 cm, lined up with the point cloud
- Six printed map sheets, an accuracy report and CAD files
- A private link to our online viewer, to turn the whole site in 3D from a browser
The map sheets
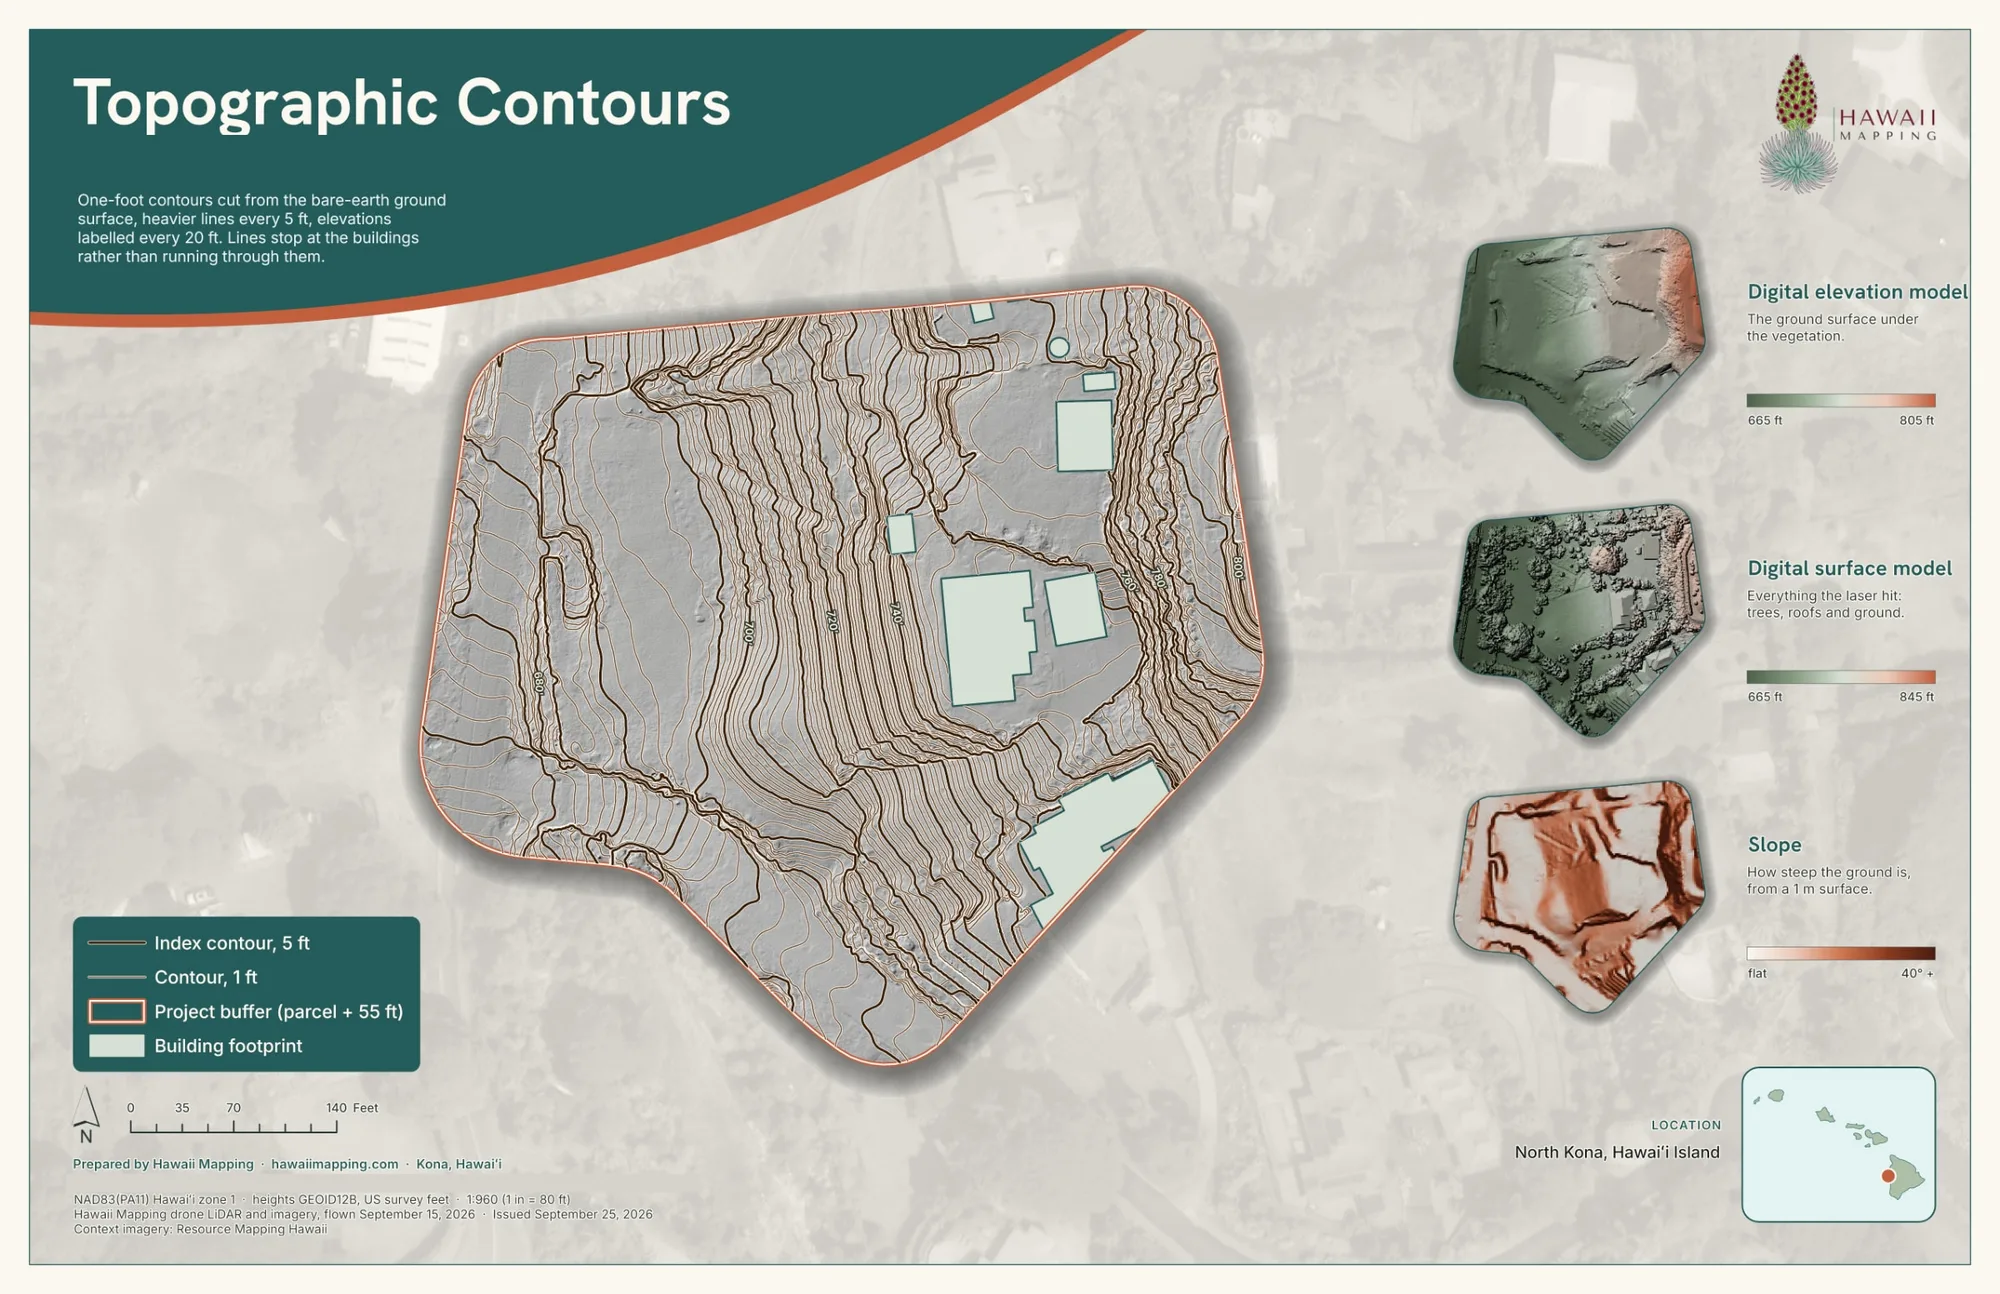
Every package ships with map sheets a person without GIS software can print or read on a phone. These are the delivered sheets, with only the street address and parcel number taken off for this page.
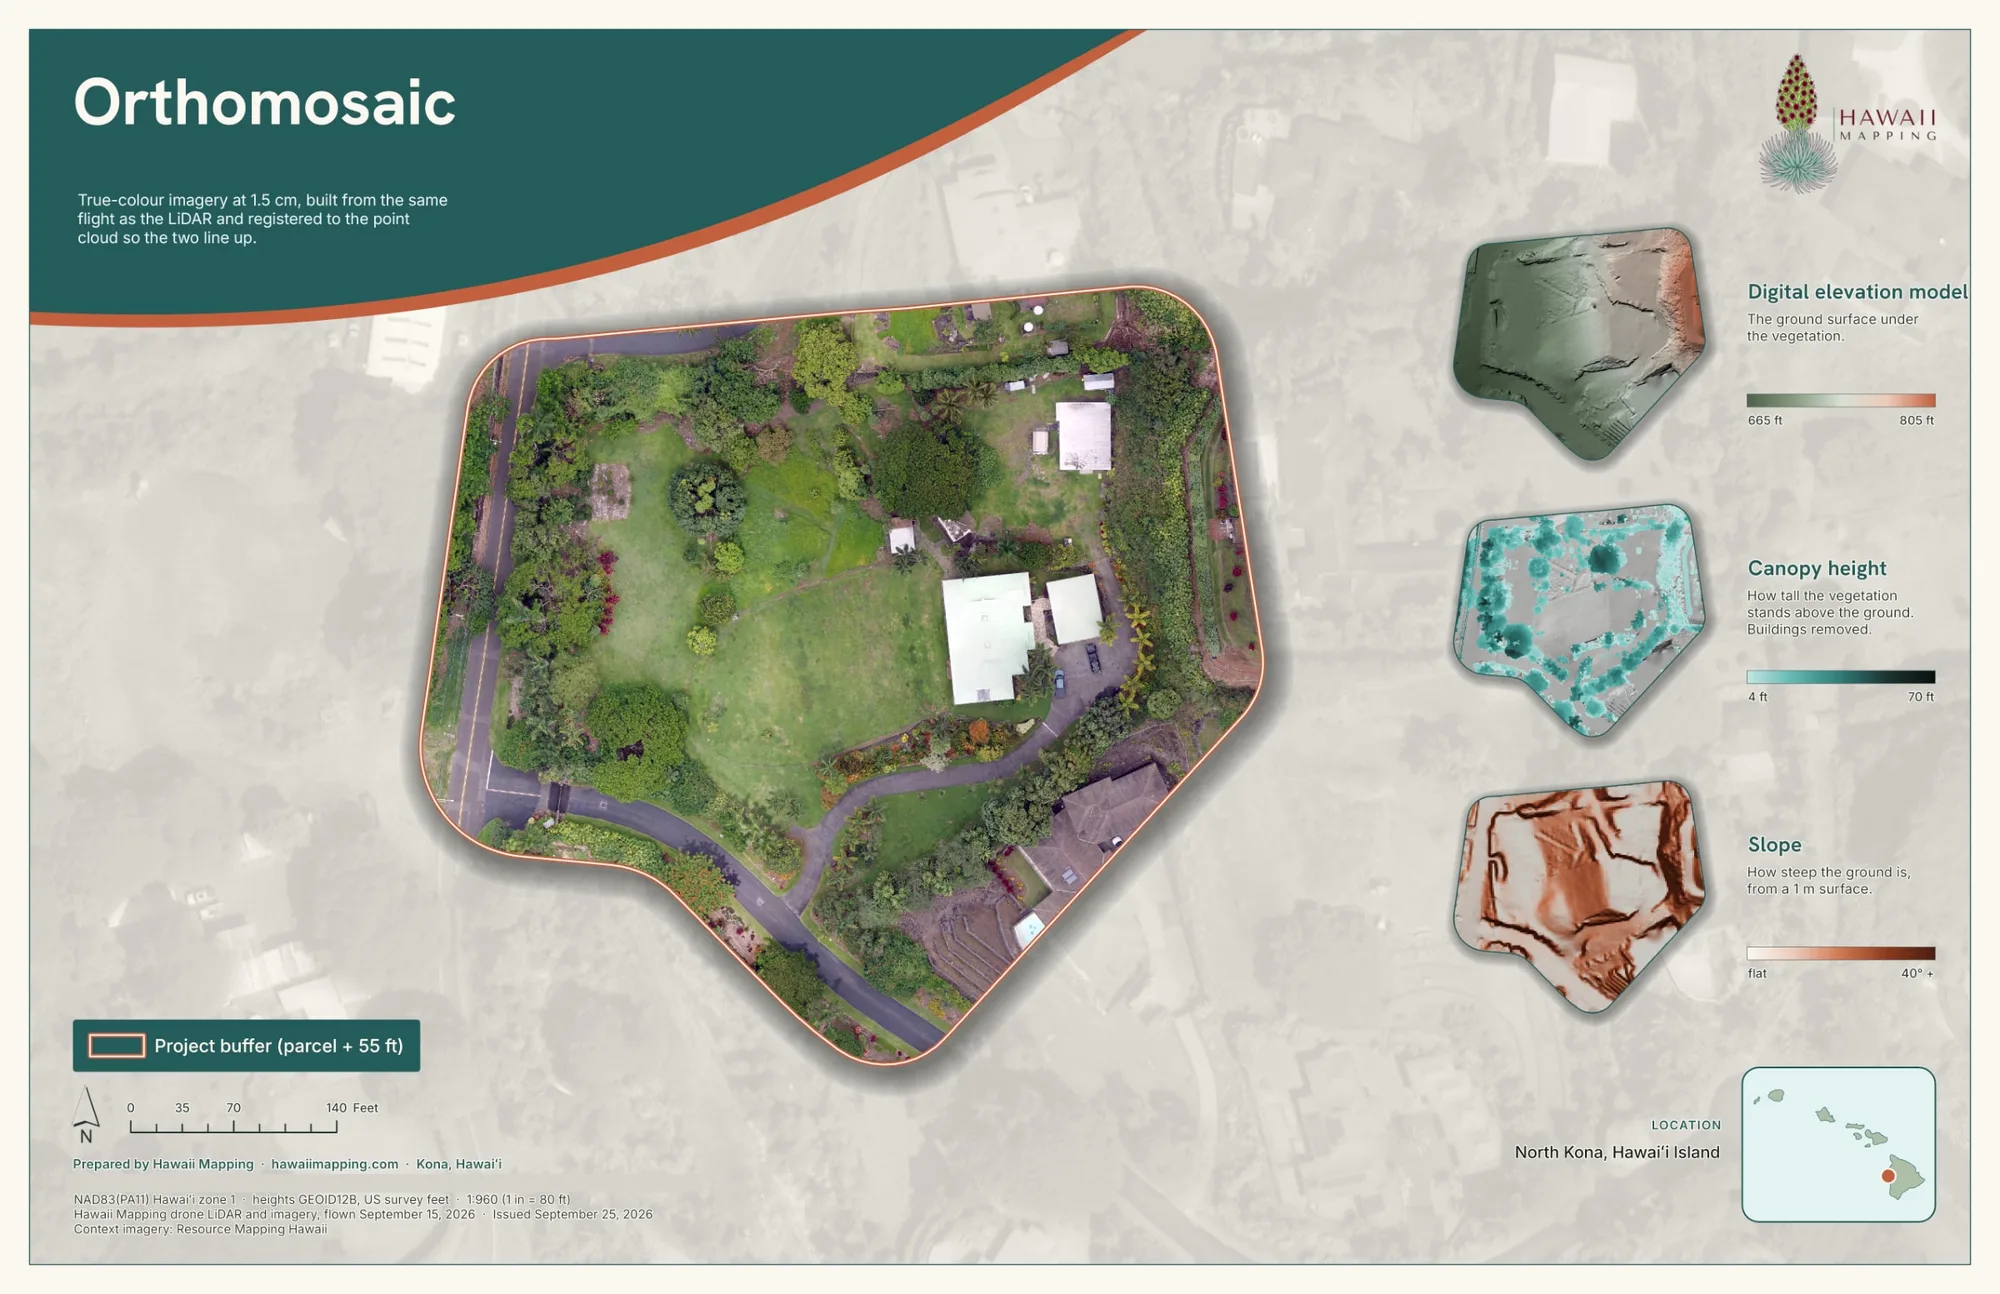
How it looks from above
Checked against USGS lidar
Heights are only useful if they are right. We compared our ground with the public USGS 3DEP lidar that covers this part of Kona. On open ground the two agree to 0.08 m (0.25 ft) root mean square, with a median difference of half a centimeter, and the base station's own tripod turns up in our point cloud 2.1 cm from the mark it stood on. The accuracy report in the package shows the method and every number. It is a comparison with USGS data, which has its own error, not a test against check points measured on the ground; a design that needs that calls for a licensed surveyor.
In the landowner's online viewer
The whole mapped area opens in a browser: point cloud, bare earth, contours and the 2D maps, with measuring tools and downloads. No software, no files to move around.
The numbers
- points in the delivered cloud
- 57,507,170
- points on each square meter
- about 2,800
- acres mapped, parcel plus 55 ft
- 5.1
- feet of fall across the site
- about 140
- tree crowns mapped
- 303
- ft root mean square against USGS lidar, open ground
- 0.25
Counts and heights from the delivered files and the package's accuracy report.
Related work and services
Planning to build on a slope?
Send the island, the rough area of the lot and what you hope to build. We will tell you what one flight can give your architect, and roughly when.